Last Thursday, BGI uploaded three WGS data sets of NA12878/HG001. Included in this was a challenge to conduct a side-by-side analysis.
 Albert Villela of Cambridge Epigenetix drew our attention to this dataset. Given our love of benchmarking and new technologies, we applied our evaluation frameworks to this data. The technology behind the BGI-SEQ 500 was based on Complete Genomics, which was acquired by BGI.
This uses DNA Nanoballs and a probe-based method of sequencing. We have seen data from this instrument in PE50, PE100, and PE150 formats, with the number indicating the length of paired-end reads (longer reads generally lead to better analysis).
A dataset for HG001 was previously submitted to Genome in a Bottle last year, with PE50 and PE100 reads and DNAnexus conducted an assessment of these data. This analysis indicated a reasonable gap, particularly in Indels. We also demonstrated that by re-training deep learning models on BGISEQ data (as Jason Chin did with Clairvoyante and Pi-Chuan Chang with DeepVariant) it is possible to bridge this gap using only software.
Given that this new dataset is released one year later and uses longer reads, the new set provides a measure of the progress BGI has made on the instrument and the difference in using longer reads. To quickly summarize, this most recent release of BGISEQ demonstrates significant improvements relative to prior data, though a (modest) gap relative to Illumina remains.
Performance Comparisons
We downloaded the 3 WGS sets directly from EBI. All of these data were generated and submitted by BGI – 2 runs from the BGISEQ500 PE150, and one run from NovaSeq6000 presumably operated by BGI. We analyzed each WGS set in its entirety through several standard pipelines – DeepVariant, Sentieon, Strelka2, GATK4, and Freebayes. Mapping was performed by Sentieon, which produces identical output to BWA-MEM and is faster.
Because the Illumina data here was submitted by BGI, we thought it fair to also include Illumina data generated by Illumina, so we used 35X WGS NovaSeq data available from BaseSpace that we have previously included in our Readshift blog.
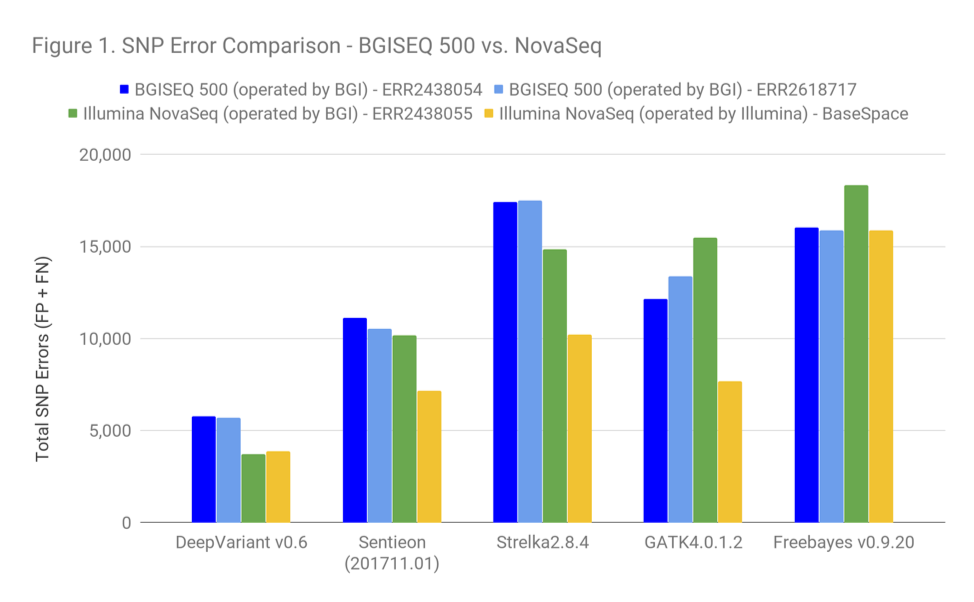 Figure 1 shows the SNP accuracy (combining false positives and false negatives). Lower bars in this chart indicate better performance. Some take-aways:
- The gap between Illumina NovaSeq and BGISEQ is quite narrow in these data. The difference between BGISEQ and Illumina BaseSpace for GATK is about the same as the difference in pipeline choice on Illumina data between GATK and DeepVariant. By this logic, if groups are OK in terms of accuracy choosing GATK, they should be OK to consider BGISEQ as well.
- The accuracy of the Illumina data available on BaseSpace is greater than the accuracy for the set uploaded by BGI. For SNPs, Illumina’s BaseSpace set is more representative of what we see in the community. The BGI set seems to be a somewhat worse sequencing run. The yellow illumina set is probably the fairer comparison.
- Note that the version of DeepVariant is NOT the one tuned with BGISEQ data ( we did not run in the BGISEQ tuned model for this investigation). It would be interesting to see whether performance will improve further on that model.
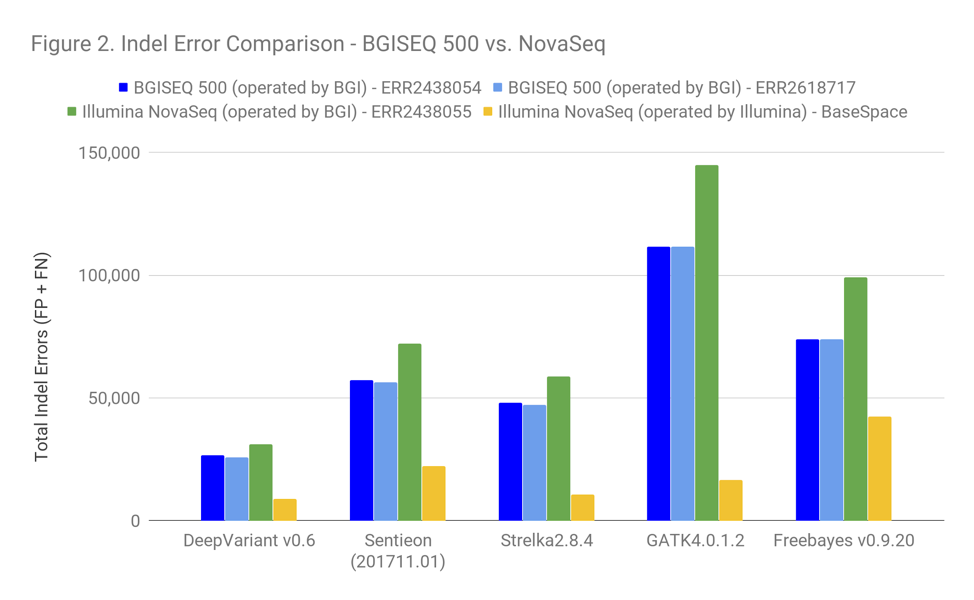 Figure 2 shows the Indel accuracy. All of the observations made previously apply with the addition of the following:
Based on the error profile of the callers here, the Illumina dataset submitted by BGI is clearly a PCR-positive dataset (based on the much stronger performance of Strelka2 and DeepVariant). Also, the impact of PCR on these data is slightly more pronounced than with other PCR-positive datasets we see.
Presumably, all available BGISEQ options are PCR-positive. However, Illumina provides the option of both PCR-free and PCR-positive preparations. Given this, it seems more fair to recommend a comparison relative to the yellow Illumina-operated NovaSeq. In addition, this is a good time to remind readers that they should be aware of the impact of PCR in sequencing quality and whether their datasets were generated with it.
Breakdown of False Positives and False Negatives
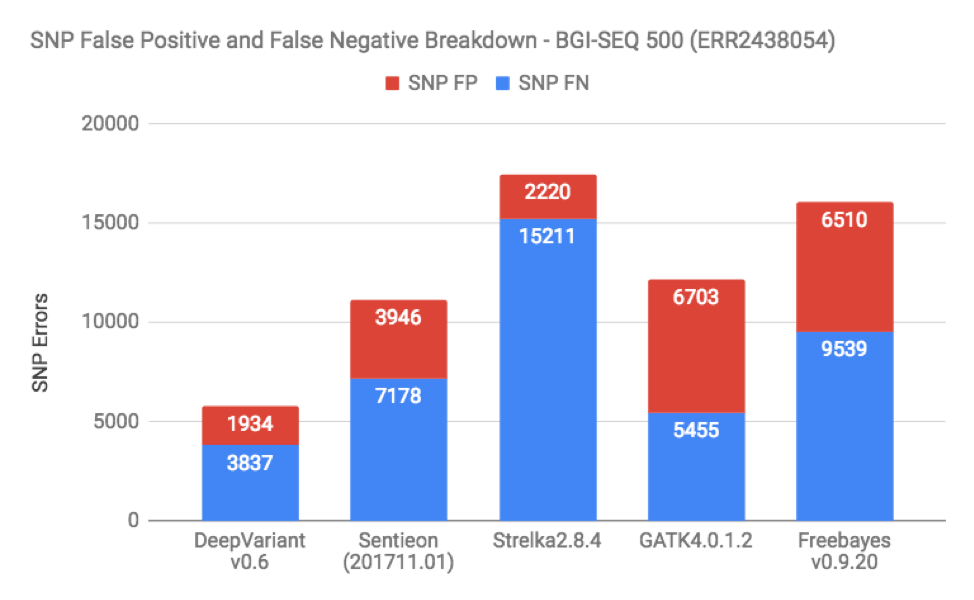
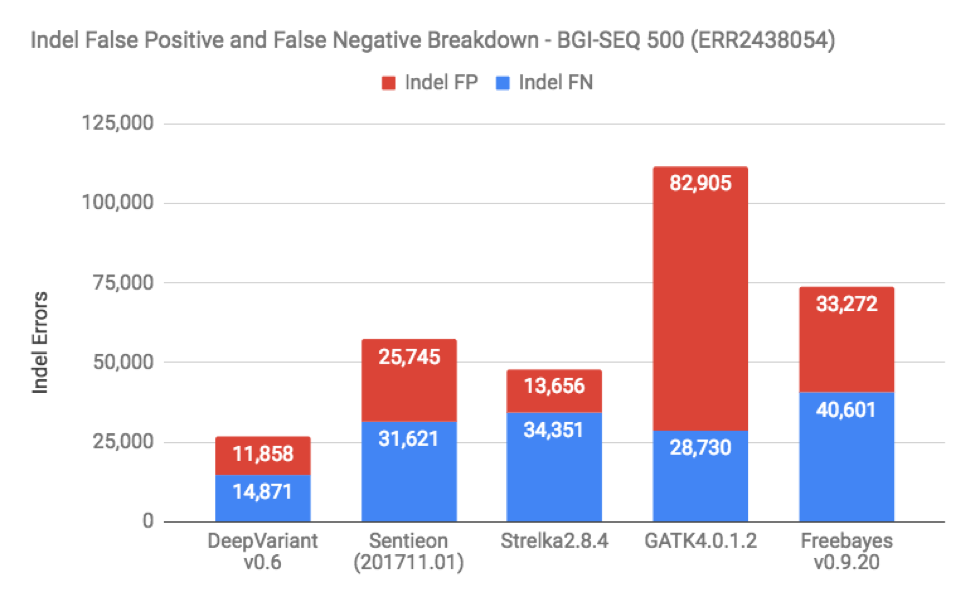
When we do these benchmarks, the most frequent request is to break down false positives and false negatives on the datasets. Figures 3 and 4 show this for SNP and Indels in one of the BGISEQ samples (which is representative of the other as well):
Finally, you may wonder if any of the programs have issues running on BGISEQ data (or run longer). The answer is – not really. Computationally, performance seems similar to what we see in Illumina data:
Conclusion –
If this newest data is broadly representative of BGISEQ performance, the BGISEQ looks like a technology worth considering. The price points that we have heard second-hand indicate that buyers would consider tradeoffs between less widely adopted and (slightly) less accurate BGISEQ genomes in exchange for better economics. Based on these benchmarks, these differences in accuracy are not so extreme that BGISEQ genomes would be considered very different.
It is important to note that these samples are PE150, the PE50 and PE100 may have worse performance. It is also important to note that these were specifically put out by BGI and likely represent the highest quality runs from the instrument.
Given that it is still early in the lifecycle of the instrument, it will be important to rigorously QC runs until the community has a good feel for the consistency of BGISEQ quality. If anyone else has runs of HG001/HG002/HG005 from the BGISEQ, I would love you to reach out to us (acarroll@dnanexus.com) so we can replicate this analysis from community-driven runs.



.png)
.png)
.png)