
Whether you have a large user base or just a few users, managing enterprise multiomics cloud spending can be a daunting task for any organization. To tackle these challenges, DNAnexus has developed a comprehensive set of new features aimed at helping your organization maximize its analysis budget.
While the platform has several existing capabilities for software developers to optimize spending and forecast analysis costs (such as native and open source cloud optimized tools and Smart Reuse) these new spend management features are tailored for users such as project leads, system administrators, and financial personnel to provide insights into organization and project spending at a higher level.
Monitor and Reduce Cost with Project Usage Reporting Capabilities
Projects are the core of work organization in a life science setting. On the DNAnexus Platform, projects serve as collaborative workspaces where files, applets, and workflows are stored and shared. Understanding individual project spending helps organizations align cloud expenses with internal work objectives, ultimately enabling better resource allocation decisions.
The introduction of Project Usage Reports allows for a detailed breakdown of monthly spend within each project. These reports cover compute, storage, egress, and dearchival costs, along with metadata for further categorization. By utilizing visualization tools within DNAnexus or importing these reports into your own 3rd party tools, you can easily analyze and filter the data to gain insights into spending patterns.
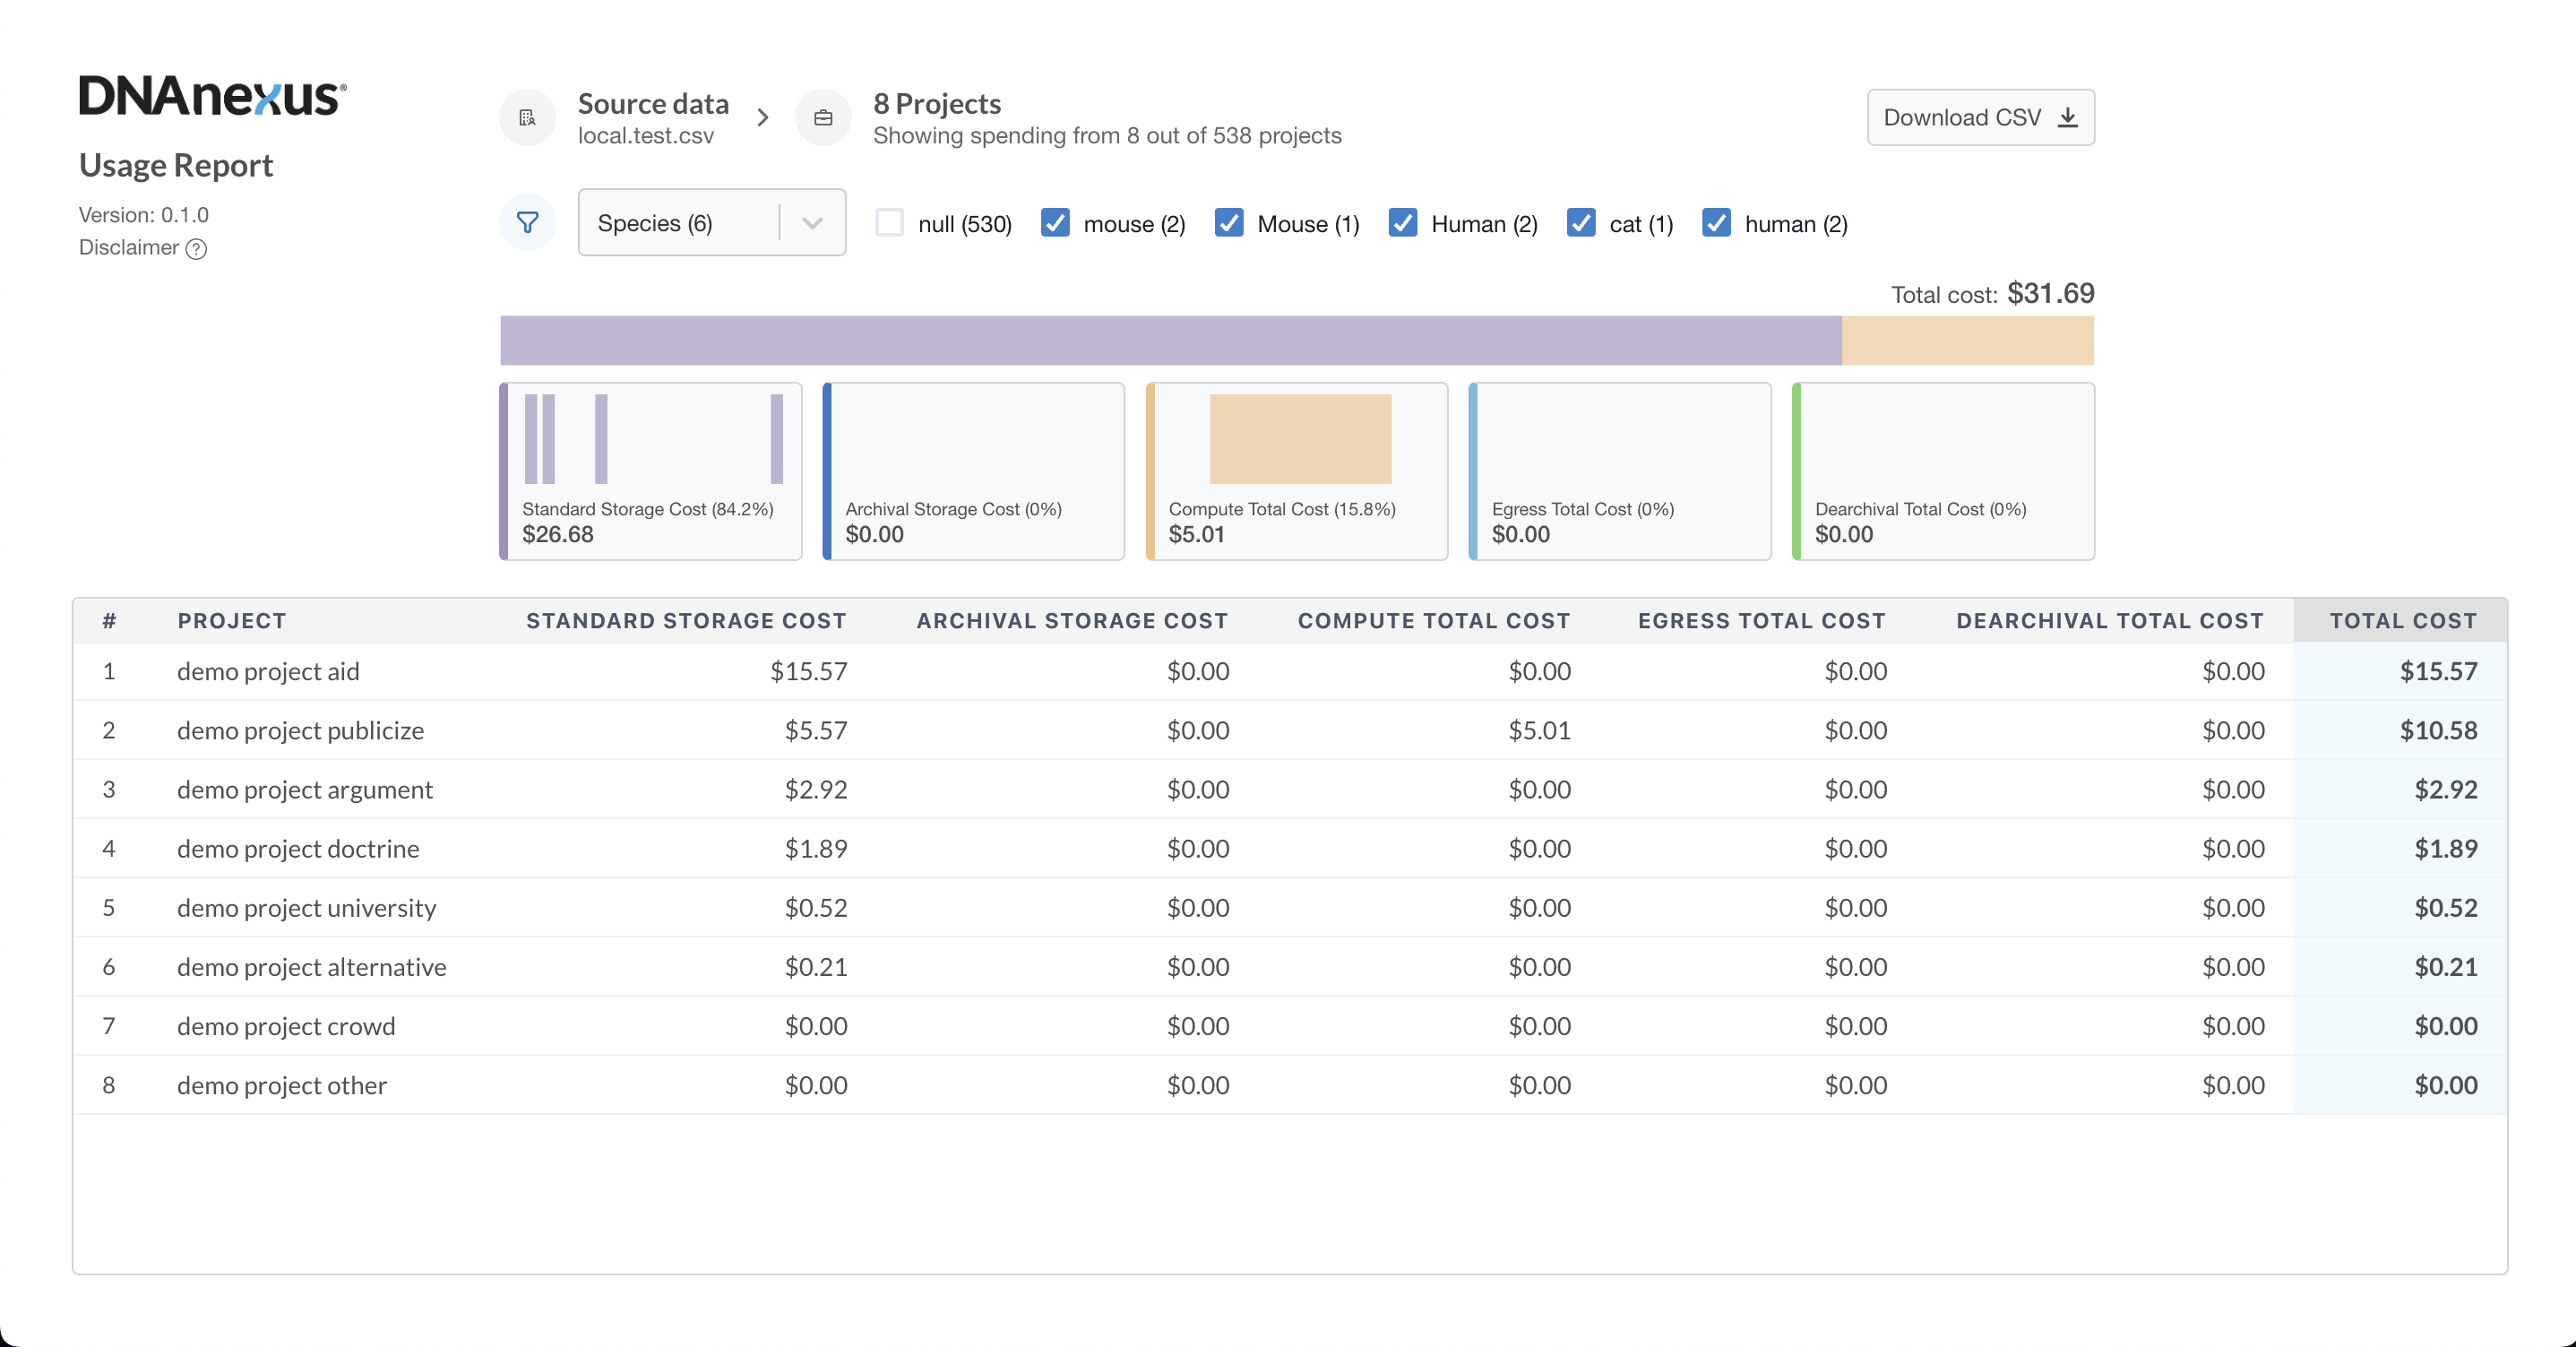
Figure 1. Project Usage Report Visuals. In this example, the Source data is the Project Usage Report CSV file “local.test.csv”. This file contains spending reports from 8 projects and the total cost across these projects is $31.69. The filter “Species” has been applied to the data and mouse, Mouse, Human, cat, and human have been selected. The total Standard Storage Cost, Archival Storage Cost, Compute Total Cost, Egress Total Cost, and Dearchival Total Cost, for those selected species is shown. The grid below lists each of the individual 8 projects and how they contribute to the totals shown above.
Root Execution Reporting
A second report, Execution Stats, provides information on each Root Execution within the same billing cycle as the Project Usage Report. This report includes details such as execution IDs, creation times, costs, and more to let you get an even deeper understanding of spend.
By leveraging these reports, your organization can gain a deeper understanding of their spending habits and make informed decisions to optimize their budgets. For more information on enabling these reports, reach out to your Customer Success Manager or contact us.
Stay Ahead of Expenses with Advanced Budgeting Tools
While spending reports offer insights into past spending, they can’t help to prevent your project members from spending beyond the project’s budget or incurring unexpected overages. This can be a real problem if you’re managing multiple projects or organizations.
New Executions and Cost Spending Limits, allows project and organization administrators to manage spending in real-time to prevent overages. Setting these monthly limits for compute, storage, and egress will send a series of notifications to help you stay ahead of any unexpected charges and within budget. Notifications can be set to alert administrators when spending approaches or exceeds set limits, enabling timely actions to be taken.
Speaking of Taking Action…
The next feature, Budget Limit Enforcement, provides you the option to terminate cost-incurring actions when spending limits are reached, ensuring strict budget compliance. With budget limit enforcement once the monthly spend limit is reached, project or org members are not able to start or complete any new or existing spend events (such jobs, storage, or egress) until the monthly budget resets or the Project or Org admin changes the Spend Limits.
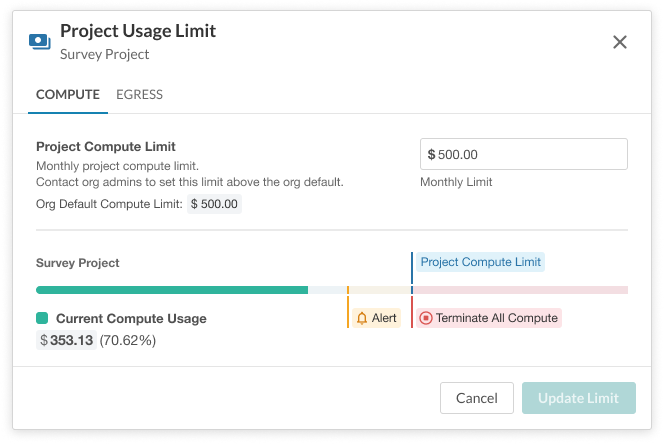
Figure 2. Project Usage Limit, Compute Visual. In this example the monthly spend limit for the project “Survey Project” is $500.00, which is also the same as the default org compute limit. In this case the Survey Project is at 70.62% of its current spend limit and has not yet hit the threshold to initiate the Alert or Terminate actions.
By combining Project Usage Reports with advanced budgeting tools you can ensure that your organization stays on track with spending while also enabling informed decisions to optimize analysis budget effectively.
To see these new features in action and hear how other organizations are tackling spend management be sure to join the upcoming webinar Maximizing Cost Efficiency in the Cloud for Omics Data Analyses with Dr. Fabian Grandke.


.png)
.png)
.png)