
I will be contributing to a panel and an emerging session at this year’s Organization for Human Brain Mapping Annual meeting in Montreal this July. In preparing for this session I was reminded that I’ve been meaning to put together a brief summary of my presentation from last year’s meeting in hopes of spreading awareness about the many opportunities that UKB-RAP presents for machine learning with (neuro)imaging data.
Challenges and Solutions to Working with Machine Learning and AI for Biomedical Data
The use of advanced analytical techniques, such as deep learning and machine learning, promise to improve the accuracy and efficiency of image analysis algorithms and ultimately make it possible to diagnose and treat diseases earlier and more effectively. There are some challenges, however, to working with machine learning or AI for biomedical data and these challenges can be even more pronounced when working with neuro imaging data.
The first challenge is simply access/availability of data. Any scientist will tell you that a volume of quality data is always needed regardless of the experimental application, however, this requirement is especially true when looking to utilize computer-aided techniques. Advanced machine learning algorithms work best when utilizing thousands, if not millions, of data points and these data must be matched with other participant information (specifically phenotypic data) and standardized metadata in order to be useful for most applications. Unfortunately, it is rare to have these amounts of data (especially imaging data) available when studying human subjects.
Fortunately, the UK Biobank has a rich collection of biomedical data for more than 500,000 people from across the UK and includes a variety of imaging data types (e.g. brain, heart, whole body, eye, etc.). In addition, many of the imaging collections in the biobank have been pre- processed by standardized processing pipelines (e.g. including quality control, preprocessing such as filtering and image segmentation) into a form of Image Derived Phenotypes (IDPs), that can be used as the inputs for training machine learning models. For reference and detailed explanation of what IDP is, we covered an introduction to IDPs in our two “Image Analysis on the UK Biobank Research Analysis Platform (UKB-RAP)” webinars [https://www.youtube.com/watch?v=d6uEl4U8NEM], [https://www.youtube.com/watch?v=BMAgenSxF_o].
For those specifically interested in aging or other brain related research, the UK Biobank has scanned over 50,000 participants to date for neuroimaging. Raw images such as magnetic resonance imaging (MRI) for the brain or PNG files for optical coherence tomography can be directly fed to machine learning models. Moreover, UK Biobank phenotypic data encompasses a range of environmental, summary diagnoses, physiological, and cognitive test data, including International Classification of Diseases (ICD) information, which can be beneficial for those who would like to work with specific cohorts or analyze data for a particular disease of interest.
Another challenge to utilizing AI techniques for biomedical research is scientific collaboration and secure storage of data. For secure storage and access, UK Biobank selected us at DNAnexus to provide the UK Biobank Research Analysis Platform for researchers (UKB-RAP). UKB-RAP is a secure research environment that brings the researcher to the data, making data access and compute power widely accessible to vetted and authorized researchers.
To illustrate how a machine learning data scientist might use UKB-RAP to train models on image derived phenotypes while collaborating with genome scientist colleagues, I’ll provide an example of analyzing image derived phenotypes using the DNAnexus Cohort Browser and JupyterLab within UKB-RAP.
Training models on image derived phenotypes
In this example, the brain imaging data have already been pre-processed using specific neuroimaging pipelines [https://doi.org/10.1016/j.neuroimage.2017.10.034] and now it’s time to share this UK Biobank data with disease specific researchers or genomic scientist colleagues. To do this, the data is ingested into the UKB-RAP database so that my colleagues can explore the data via the Cohort Browser [https://dnanexus.gitbook.io/uk-biobank-rap/getting-started/working-with-ukb-data#browsing-dataset-fields-using-the-cohort-browser]. My genomic scientists or disease specific researcher colleagues can then use this tool to create cohorts based on tissue model quantification. These defined cohorts can then be fed into the machine learning algorithms or can be used for genome/phenome wide association studies.
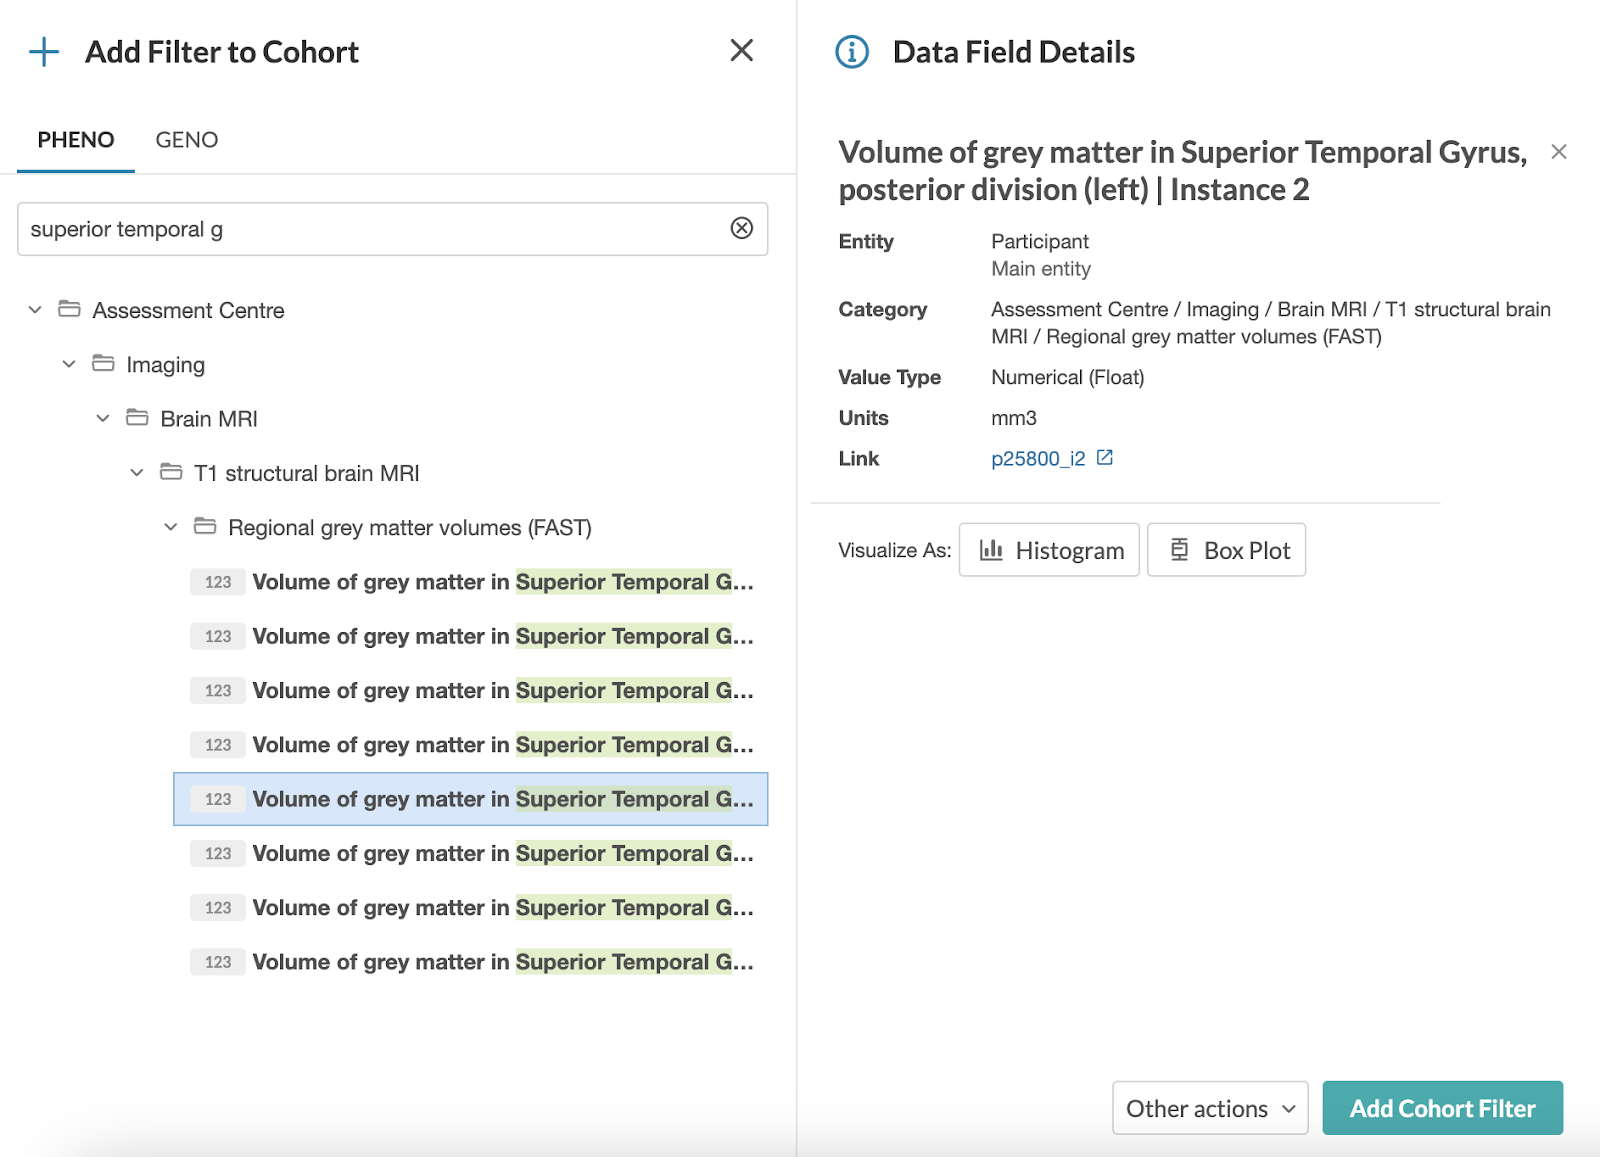
The figure below (Figure 1) is a screenshot of the data after it’s been loaded into the UKB-RAP Cohort Browser. We can see a list of specific volumes or extracted data from the specific brain regions. Based on these fields, we can then create cohorts and select specific participants by applying filters. Information on the data fields can also be visualized.
FIGURE 1.
Screenshot of data loaded into UKB-RAP Cohort Browser. Filter fields are selected and shown along the top. A full list of data from specific brain regions is displayed along with details about data fields and a preview of the data.

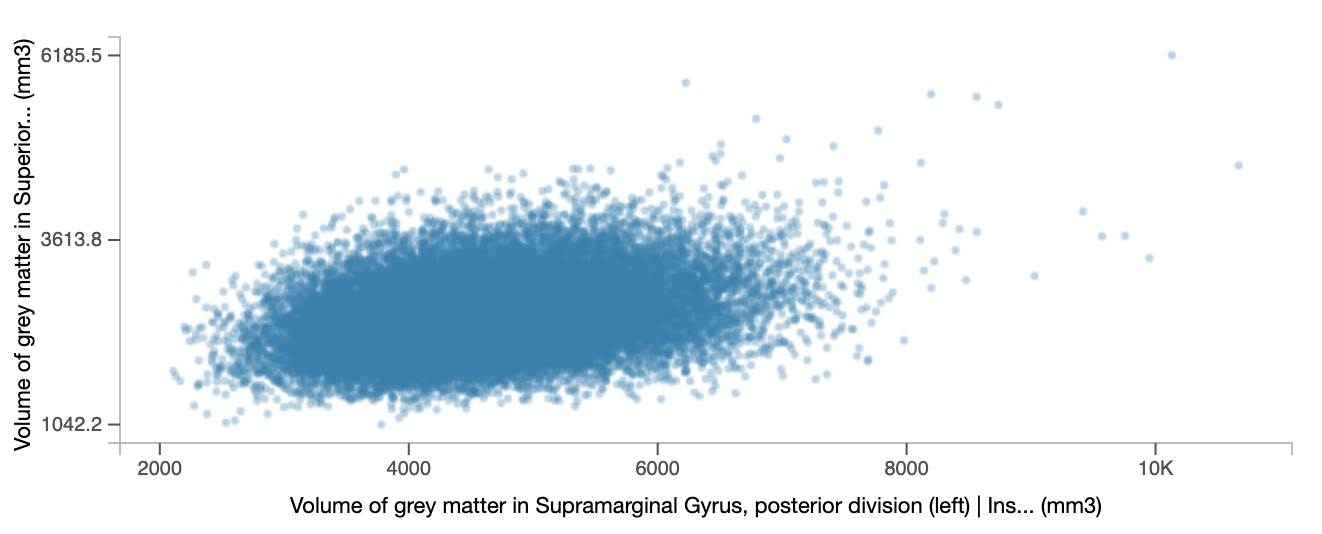
When filtering is active, we can then create some simple plots and explore our data visually. For example, we can create a scatter plot and assess possible correlations in the data. An example plot is shown in Figure 2.
FIGURE 2.
Example scatter plot with data from 46392 individuals.
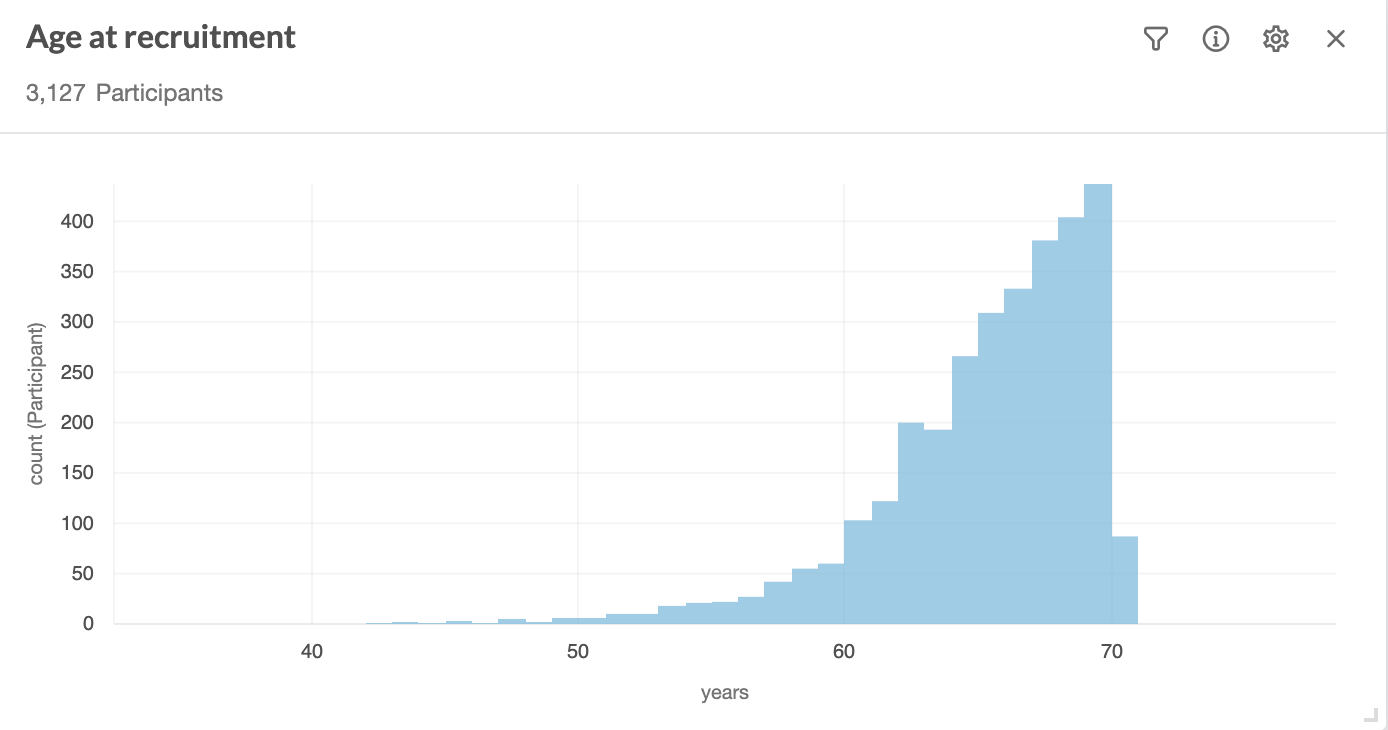
The UK Biobank does not only contain information on healthy individuals, as mentioned above, but also contains a series of diagnostics data classified using ICD codes. By using this information we can focus on a specific disease category such as dementia and Alzheimer’s disease and study the specific cohort of participants (Figure 3)
FIGURE 3. Cohort Browser enables creating cohorts for specific ICD10 disease categories.

To conduct some machine learning experiments on the dataset, we decided to train a proof-of-concept model to predict age based on several brain volume features. Predicting brain age is clinically important and several recent studies used UK Biobank brain imaging data to develop the brain-age models and test various aging-related hypotheses, just to list a few [https://elifesciences.org/articles/81067, https://onlinelibrary.wiley.com/doi/full/10.1002/hbm.25368, https://www.ncbi.nlm.nih.gov/pmc/articles/PMC7280786/, https://elifesciences.org/articles/52677, https://pubmed.ncbi.nlm.nih.gov/31201988/].
In this experiment, we focused on randomly selected 3,000 participants with full brain imaging information available and evaluated our models using 10-fold cross validation. Our model was trained using a list of preselected neuroimaging derived phenotype data which is in tabular format. We programmatically defined cohorts in JupyterLab™ [https://dnanexus.gitbook.io/uk-biobank-rap/working-on-the-research-analysis-platform/using-spark-to-analyze-tabular-data]. For the modeling phase, we used the LASSO model from scikit-learn. To measure performance of our model, the following metrics were computed: Pearson correlation coefficient, r squared metric and mean absolute error. We did not perform any hyper-parameter tuning. For reproducibility reasons, we then saved the whole computation environment (notebook + trained model + loaded libraries) to the permanent project storage in the UKB-RAP.
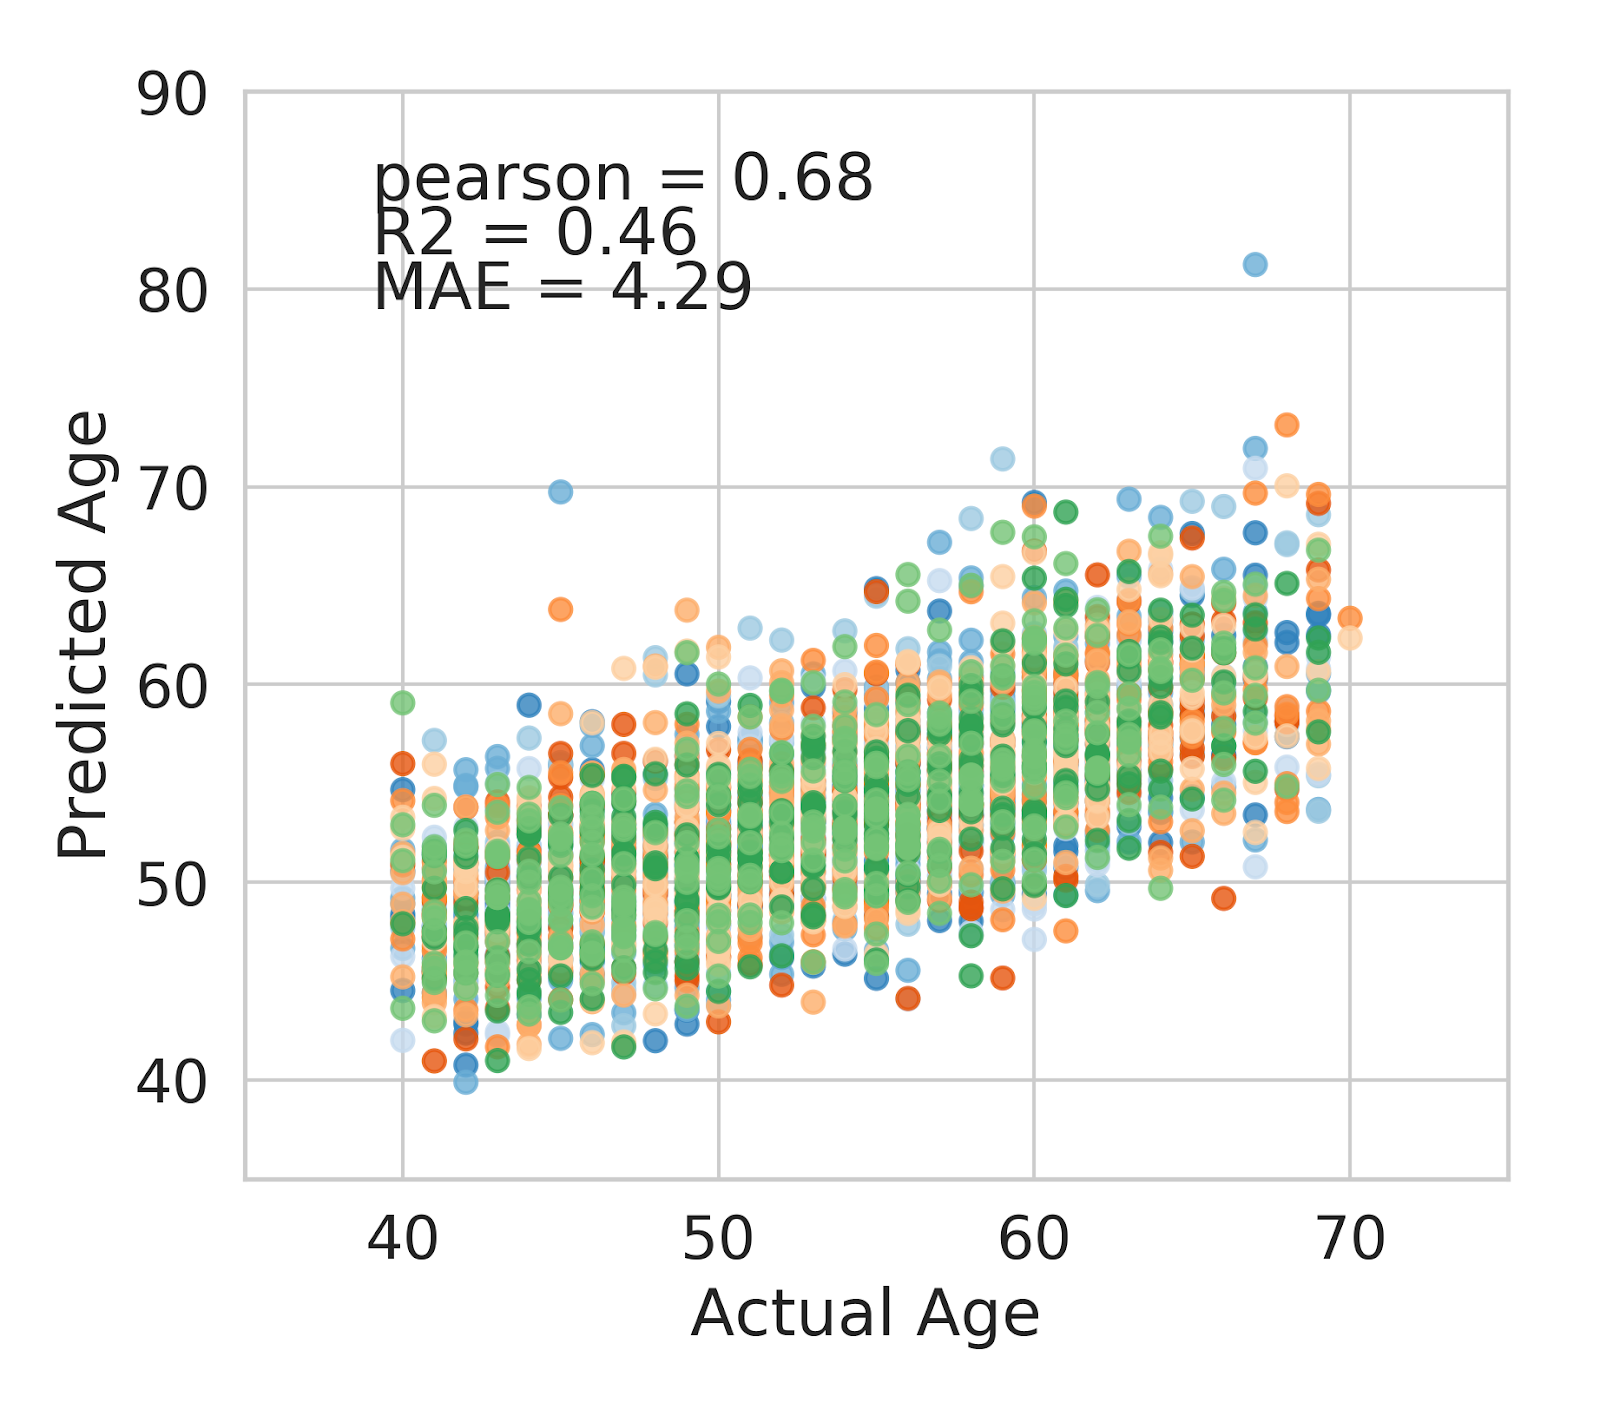
Now we are ready to look at some pilot results. First, we look at the data in table form and obtain correlations of selected individual neuro imaging features with age (Figure 4). We also created plots showing the results of our trained model. In Figure 5, we first reduced data into two dimensions and inspected a Principal Component Analysis (PCA) plot and in Figure 6, we can finally see a performance of the trained LASSO regression model to predict age based on brain volumes.
FIGURE 4.
A table view of correlations of individual brain volume features with Age at recruitment
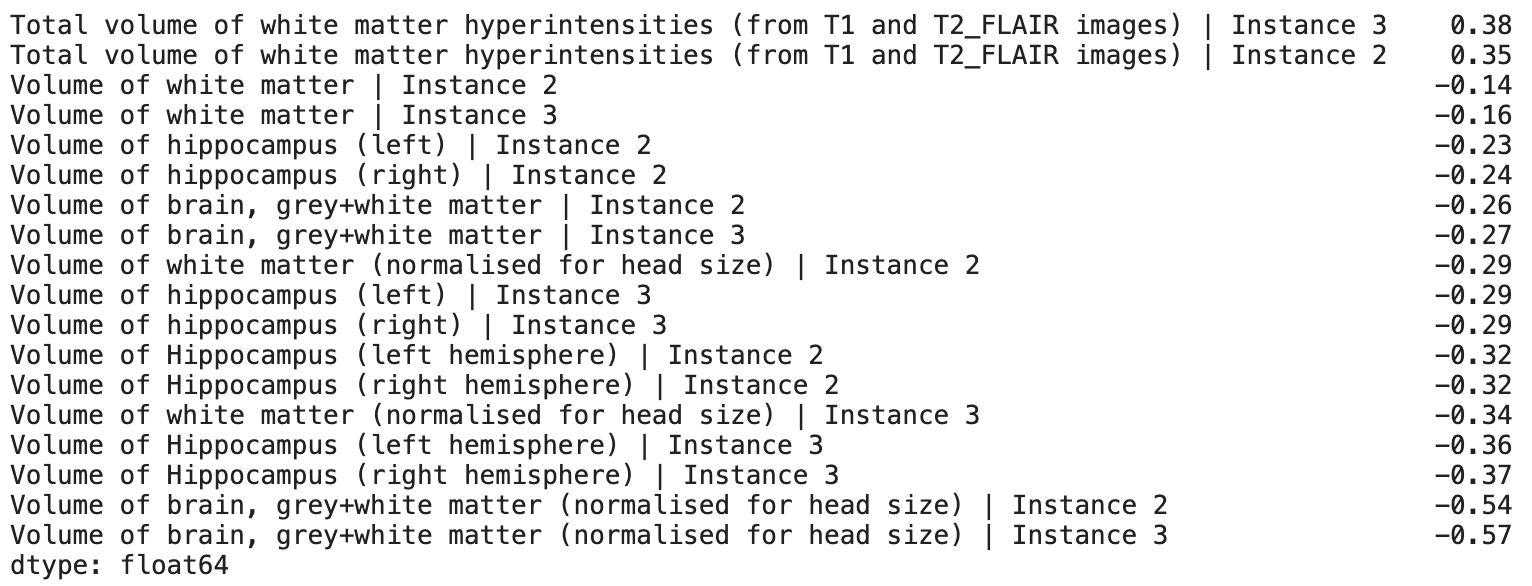
FIGURE 5
Principal component analysis plot. Individual data points are coloured by Age at recruitment.
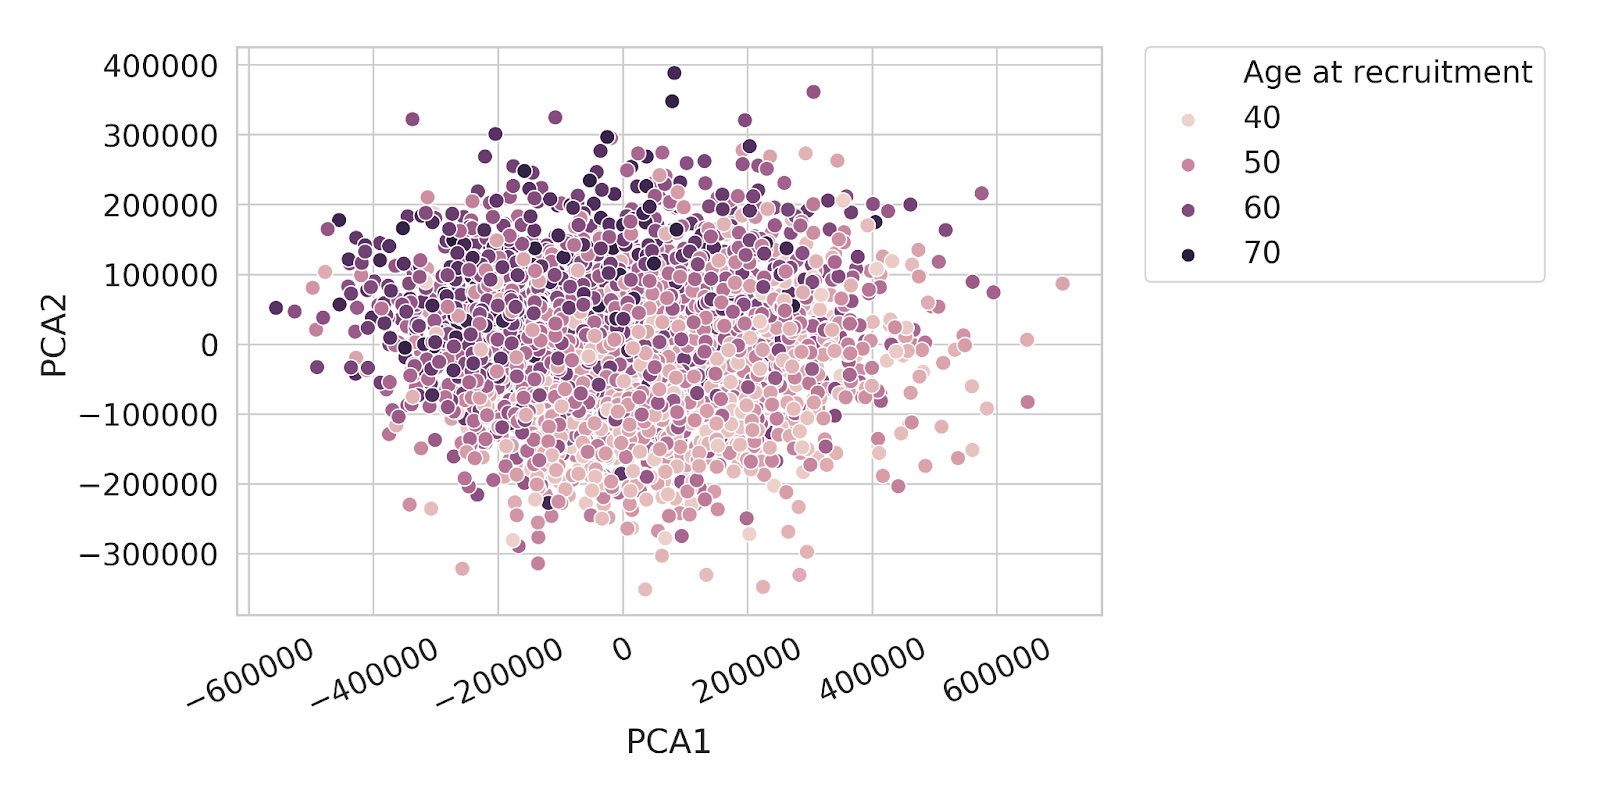
FIGURE 6.
Model performance on testing data. Each individual color in the plot represents one cross validation run.
Summary
I hope that this brief example has given you some flavor for what is possible in terms of machine learning utilizing UKB-RAP imaging data and how the platform allows users to deploy models in a secure and reproducible environment. For more information on machine learning and AI in UKB-RAP or DNAnexus, reach out to the imaging section of our Community Portal.
Acknowledgements
Presented materials were carried out using UK Biobank Application numbers 46926 and 82561, and we thank the participants in the UK Biobank imaging study. This project would not have been possible without the amazing and supportive DNAnexus Marketing team, and Biobank Community team, led by Asha Collins, PhD, and Chai Fungtammasan, PhD.


.png)
.png)
.png)