
The Need for the Mosaic Standards Challenge
Study of the human gut microbiome – the collection of bacteria that dwell in the lower intestinal tract of every person – is a challenging task. Given the sheer number of bacteria present, along with the diversity in numbers of different species present, analyzing this environment requires collecting huge amounts of sequencing data in order to make an accurate profile of microbial composition.
Because of the complexity of this environment, it’s important to control all sources of potential variation due to experimental design. Many researchers focus on making sure that they use a consistent bioinformatics pipeline, but this isn’t the only source of methods-based variation – almost every choice in the experiment, from the extraction kit used to the sequencing method chosen, has the potential to skew the results of a microbiome examination.
To examine these sources of variation and better determine the magnitude of their effects, DNAnexus partnered with the Janssen Human Microbiome Institute (JHMI), the National Institute for Standards and Technology (NIST), and the BioCollective to launch the Standards challenge. We offered to provide a sample kit to any participant who joined the challenge. Each participant agreed to extract and sequence these provided samples, and provide Mosaic with the FASTQ files and the details of their processing, extraction, and sequencing protocols.
The Standards Challenge Sample Kit
On the Mosaic platform, we provide information about the Standards challenge, as well as a link to join the challenge. Once a participant joins the challenge, they can place a free online “order” for a kit. Each participant is allowed up to 3 kits, so they can compare and contrast their results using different wet-lab protocols.
Each kit contains seven samples. Five are fecal samples, provided by the BioCollective, with each sample derived from a different human donor. The kit also contains two purified DNA samples, provided by NIST, which contain DNA from known bacteria at predetermined relative concentrations. The BioCollective and NIST constructed 700 of these kits, which are shipped for free to any participant around the globe.
Gathering Protocol Metadata
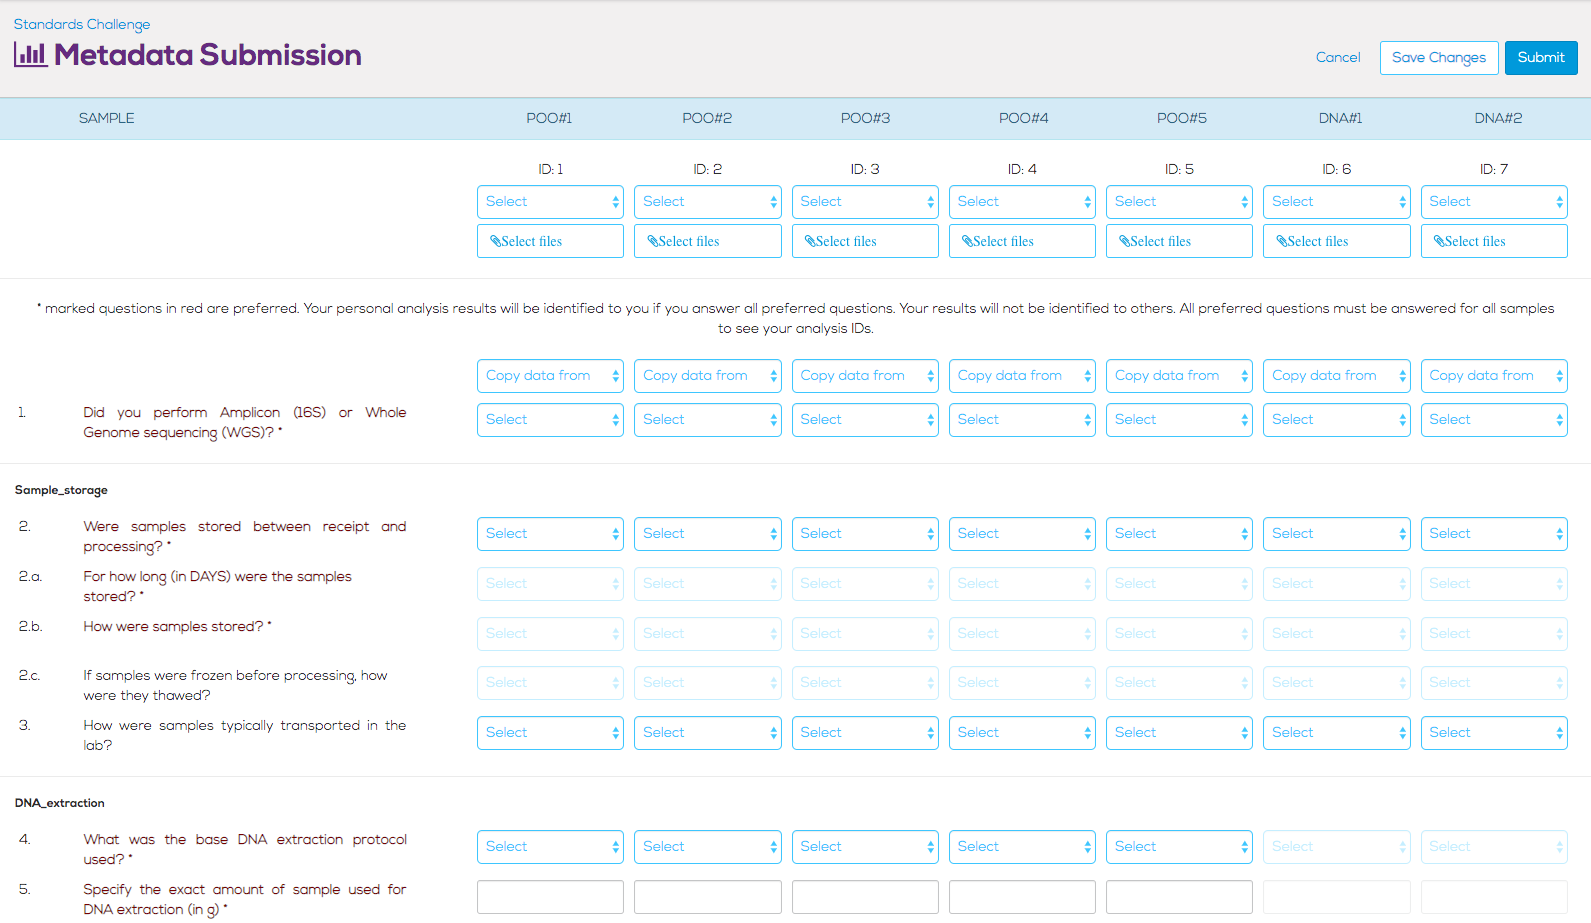
In order to properly determine what steps in the wet-lab sample processing, amplifying, and sequencing protocols have the greatest influence on variation in the sample results, we worked with several researchers and contract research organizations (CROs) to create a list of 99 questions about the protocols.
Answering 99 protocol questions for each sample is a lot of work, so we added several modifications and caveats. First, in order to submit results, only two questions need to be answered – whether the submitted sample is paired-end (to know how many input files to expect per sample), and whether the sample was analyzed using 16S rRNA profiling, or if metagenomic sequencing was performed (to properly segregate samples). If the participant doesn’t know the answer to a specific question, they are free to skip it without invalidating their submission.
However, we also want to incentivize participants to complete enough metadata questions to provide useful information to analyze. All responses that are submitted to us are anonymized, allowing commercial groups to submit without fear of potentially tarnishing their brand. We selected a subset of the protocol questions (29 questions) that we marked as “preferred”. If a participant answered all of the preferred questions for a sample, we would reveal, to that participant only, the anonymized ID of that particular sample. This encouraged participants to submit metadata answers for all preferred questions so that they could see where their individual samples fell in comparison to others.
Analyzing the Results with a Consistent Pipeline
To analyze the submitted results, we worked with Dan Knights and Gabriel Al-Ghalith at the University of Minnesota, using their SHI7 and BURST tools to perform basic quality control and species-level profiling of the submitted FASTQ data. Because we want to examine variation due to differences in wet-lab protocol, we made sure that the bioinformatics pipeline was identical for all samples. This pipeline performed the following steps:
- Ran SHI7 (v0.9.9) to provide quality control and filtering on input files
- Removed human-aligned reads using Bowtie2
- Aligned against NCBI’s Representative Genomes collection (synced to RefSeq v82) using BURST12 v0.99.7
- Anonymized file headers and created a tarball of intermediate, anonymized results
- Used QIIME2 to convert files to BIOM format, merge together all sample files for each of the 7 samples, and calculated euclidean beta diversity and principal coordinates
- Merged the principal coordinates data with the collected protocol metadata to create an interactive figure using Emperor
The intermediate tarballs, each containing the raw, anonymized FASTQ reads and the BIOM results files for each sample within that tarball’s submission, are made publicly available in the May 2019 data freeze workspace on Mosaic. The final Emperor plot may be viewed in the Results Exploration tab of the Mosaic Standards challenge page.
Exploring the Initial Standards Challenge Results
Examining the interactive Emperor plot reveals that, while the samples do segregate on the PCoA plot based on their sample ID, there is distinct variation seen among responses for each of the seven samples distributed in the sample kit.
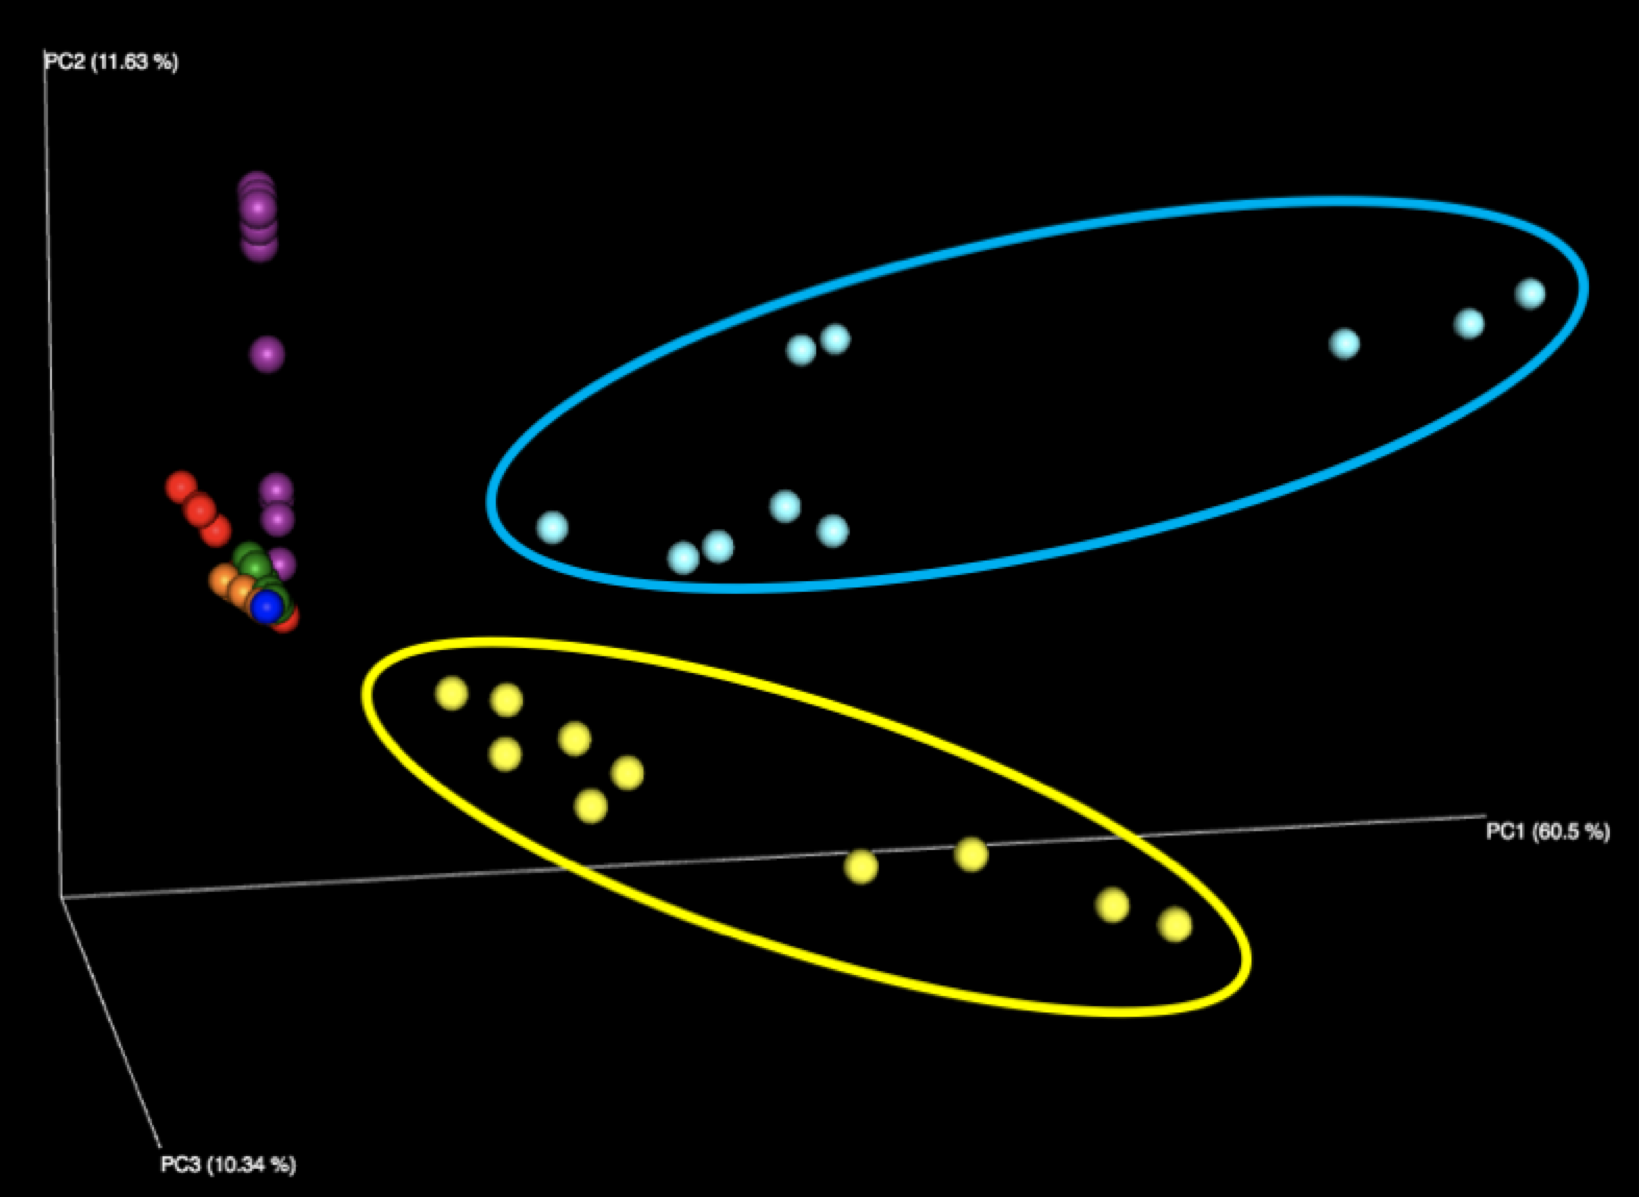
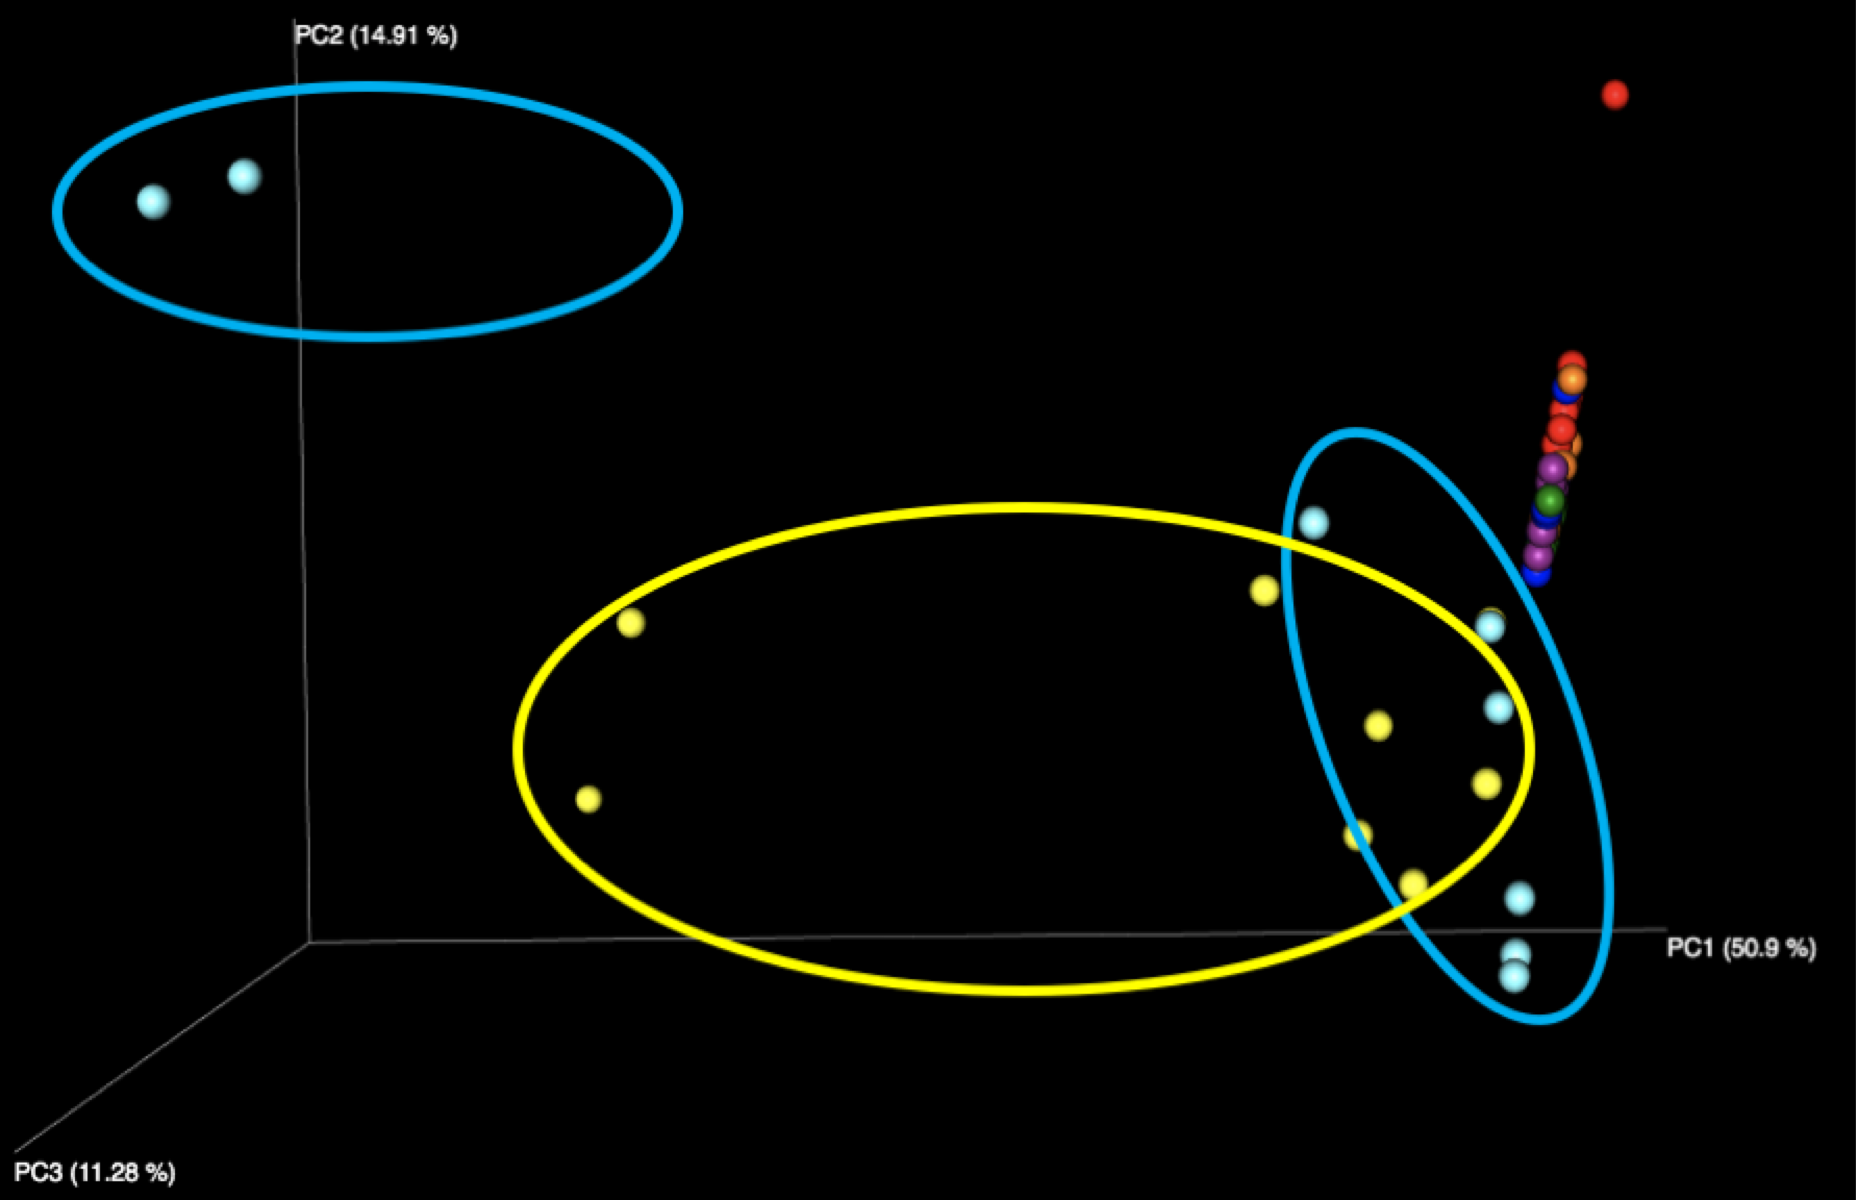
Figure 1: Examination of all WGS samples (left) and all 16S samples (right), colored by sample number within the kit. Note that the yellow and cyan points correspond to the purified DNA samples, and are more diversely distributed than the five fecal samples.
The majority of variation seen among different samples on the initial Emperor plots appears to be due to differences between the results of the fecal samples (left, outside of circle) and the results of the purified DNA samples (right, inside yellow and cyan circles) supplied in each kit. When we remove these DNA samples from the graph and focus solely on the fecal samples, we see more distinct clusters for each of the five fecal samples. We speculate that the reason the DNA samples are more spread out is because they contain substantially fewer distinct taxa, allowing noise to play a more outsized role, as well as exacerbating the effect of individual misidentified taxa.

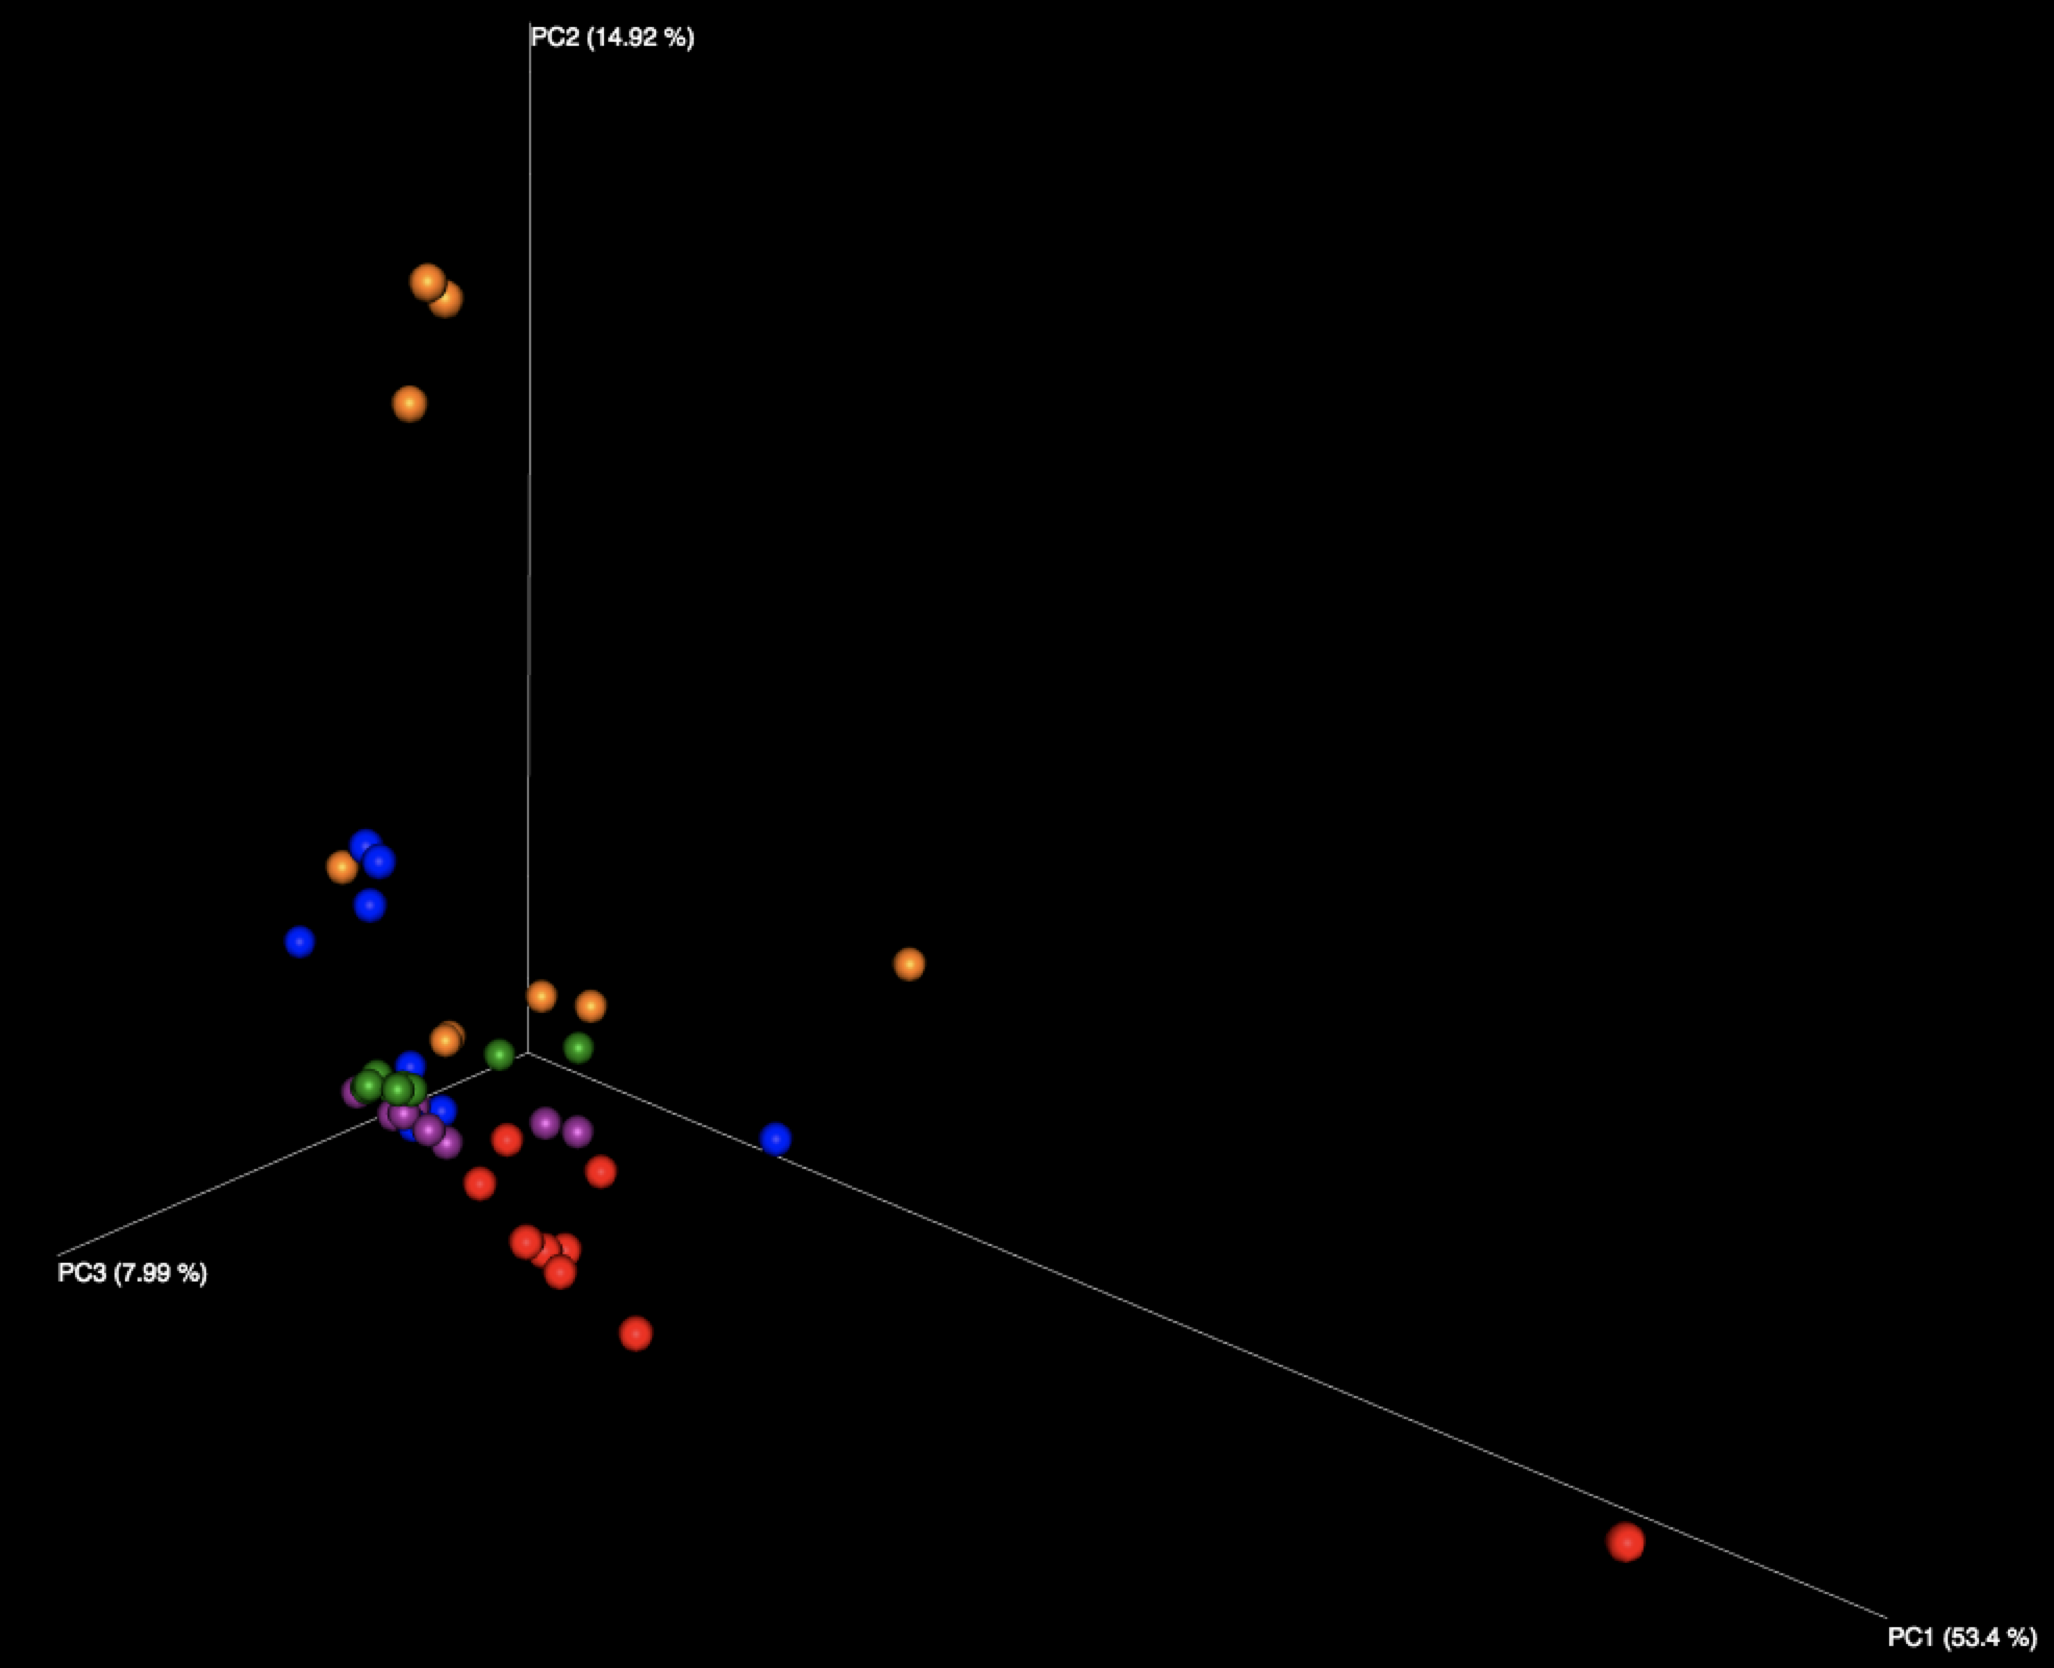
Figure 2: Examination of the five fecal samples, looking at WGS results (left) and 16S results (right). Color indicates the number of the sample, of the five fecal samples distributed in the kit.
Interestingly, all beta diversity patterns show prominent clustering that is arranged in a linear pattern by sample. While each of the 5 stool samples, as well as the purified DNA samples, can be graphically distinguished, it is notable that the stool samples using WGS sequencing have the least jitter and form reasonably straight lines. We speculate this is due to the more limited reference database used for WGS profiling constraining variability in the references chosen, while the larger 16S database, in tandem with small amplicons, amplifies the effects of subtle sequence variations in influencing the reference taxon chosen. With 16S sequencing, there is also more opportunity for various biases, including different primers, PCR amplification strategies, and amplicon length to influence the outcome than with shotgun metagenomics, which is expected to produce more uniformly random coverage of genomes present.
The fact that PCoA essentially assigns a separate axis to each sample (especially in the WGS case) may be a promising sign, as it appears each sample is much more like itself than any other, allowing samples to be distinguished regardless of which lab produced them. However, the 16S samples do not share this quality to the same extent, as we see some evidence of certain samples appearing to impinge on the trajectories of others, depending on which lab produced them.
Further Analysis of the Available Data
16S rRNA Sequencing Data
For the 16S data, we used QIIME2 to further analyze the raw data, annotating against the QIIME2-provided “GreenGenes 99% OTUs full-length sequences” reference.
Examining the 16S data at the family level of annotation, we note that several microbial families appear unique to data from one or two particular individuals, allowing results files to be identified as having been derived from these particular samples. For example, the Prevotellaceae family was most abundant in results derived from fecal sample 5 within the kits, and also present at a lower level in fecal sample number 4.
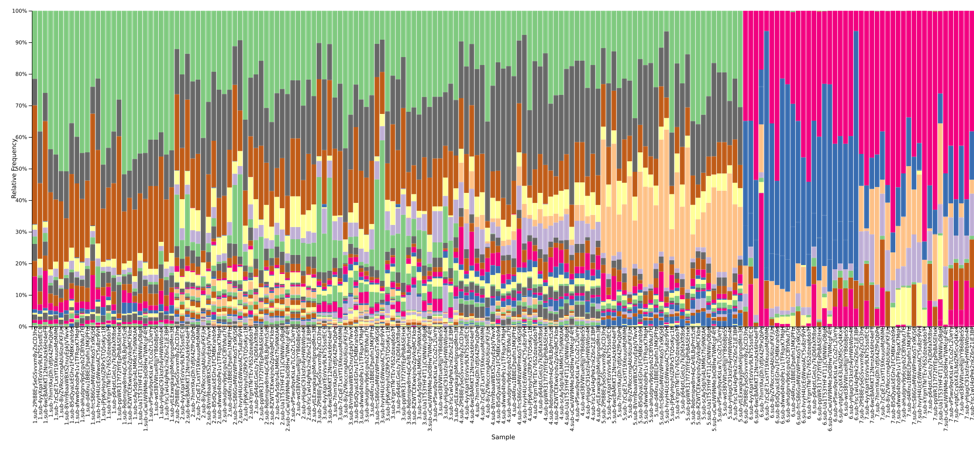
Figure 3: A QIIME2 visualization of the 16S taxonomy results for each submitted sample, sorted by sample number and colored at the family level. Samples 1-5 are fecal, with 6-7 appearing distinctly different on the right side.
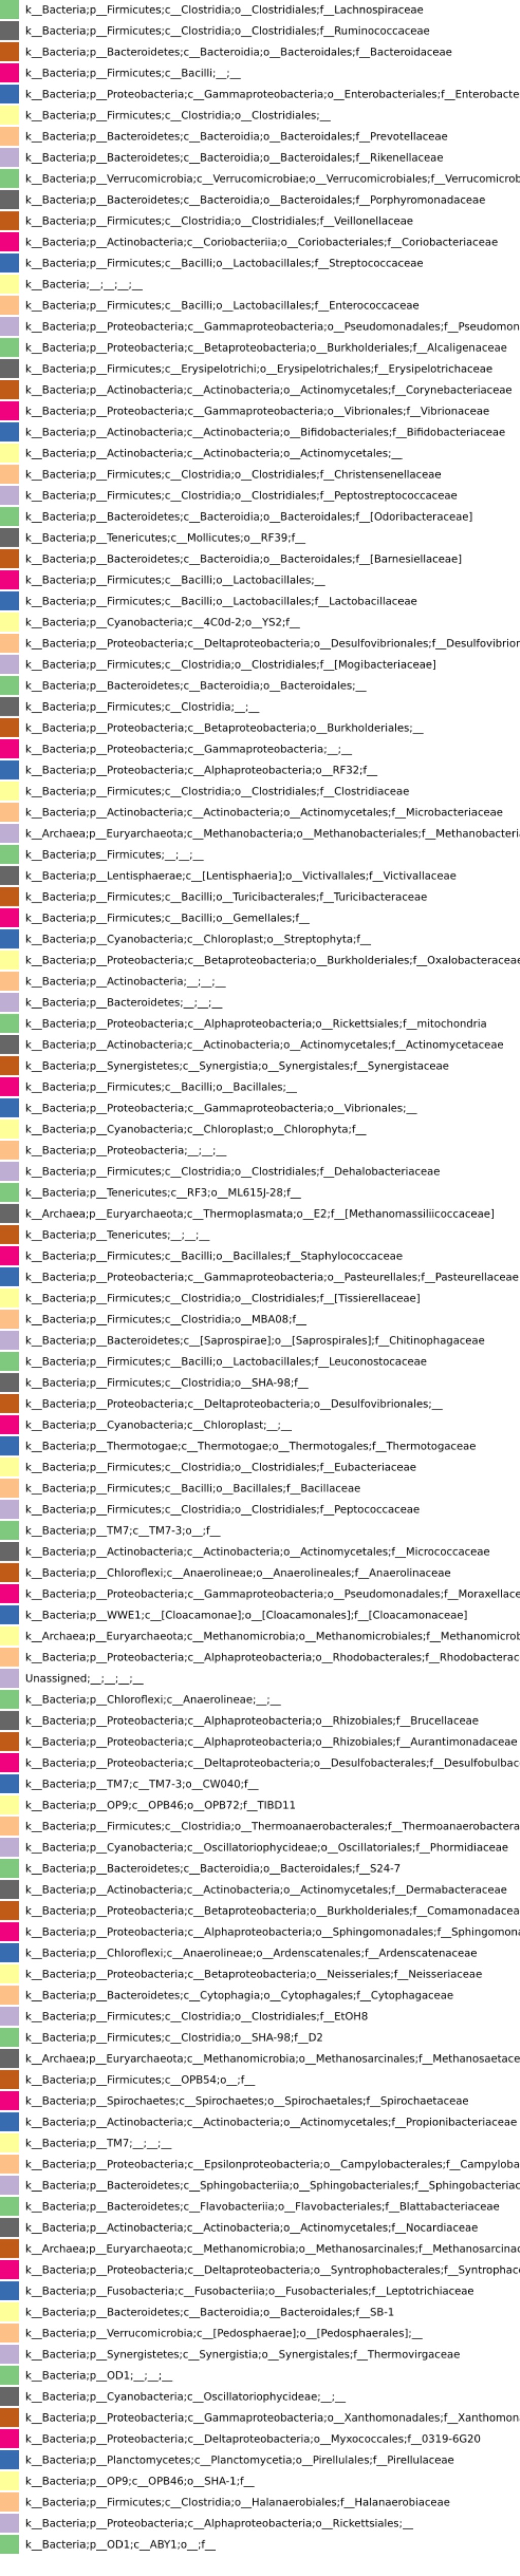
Figure 4: The legend for Figure 3, providing annotations at the family level. A link is provided below to the QIIME2 visualization file, and the data can be explored on QIIME2’s website (view.qiime2.org).
Looking at the DNA samples, we observe that the Enterobacteriaceae family is the best distinguisher of whether a sample was from the A or B mock communities distributed as pre-extracted DNA.
We provide the QIIME2 visualization file here; this can be further explored, and sorted by any metadata question, by using the online viewer at http://view.qiime2.org.
Metagenomic Sequencing Data
We further analyzed the metagenomic sequencing data using Kraken to annotate the data against the standard Kraken database, which includes bacterial, archaeal, and viral genomes from RefSeq. Kraken results were exported in MPA format so that they could be merged using MetaPhlAn2, which was also used for generating comparative heatmaps of the results.
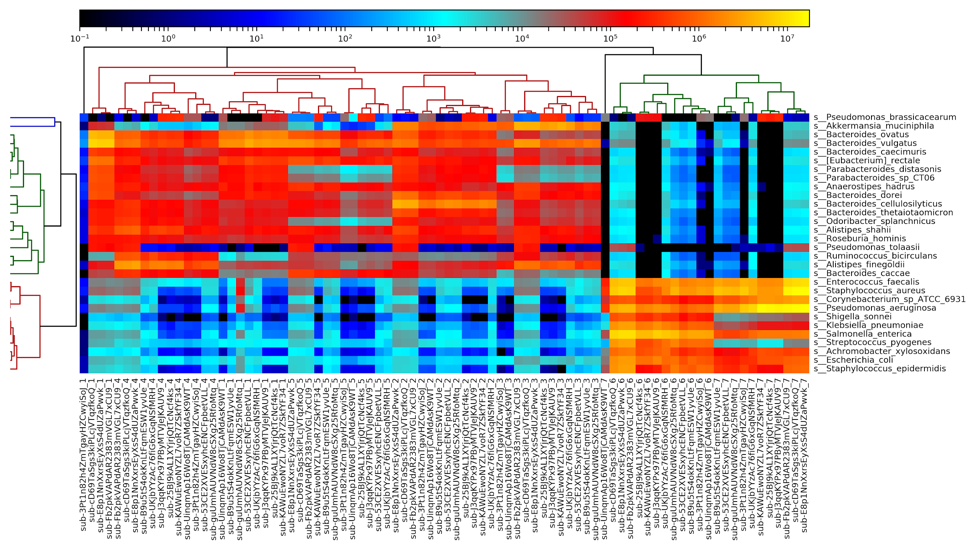
Figure 5: A heatmap of all metagenomic sequencing data, generated by MetaPhlAn2. Results largely cluster by sample number, with the fecal samples (1-5) on the left and the DNA samples (6-7) on the right.
Examining a heatmap of all metagenome samples shows a clear distinction between the fecal samples (samples 1-5) and the purified DNA samples (samples 6-7). Within the fecal samples, we see fairly clear separation of most of the samples, although some results for sample 1 are more similar to sample 4 than they are to each other. Samples 2, 3, and 5 all segregate completely. We additionally observe one outlier sample, in sample 1, on the left side of the heatmap. This sample appears highly divergent from all others, and appears to be due to a truncated file being provided, with far fewer reads than other files.
We see additional results when we generate the heatmaps for each individual sample, determining similarity of microbiome profiles by top twenty most abundant organisms.
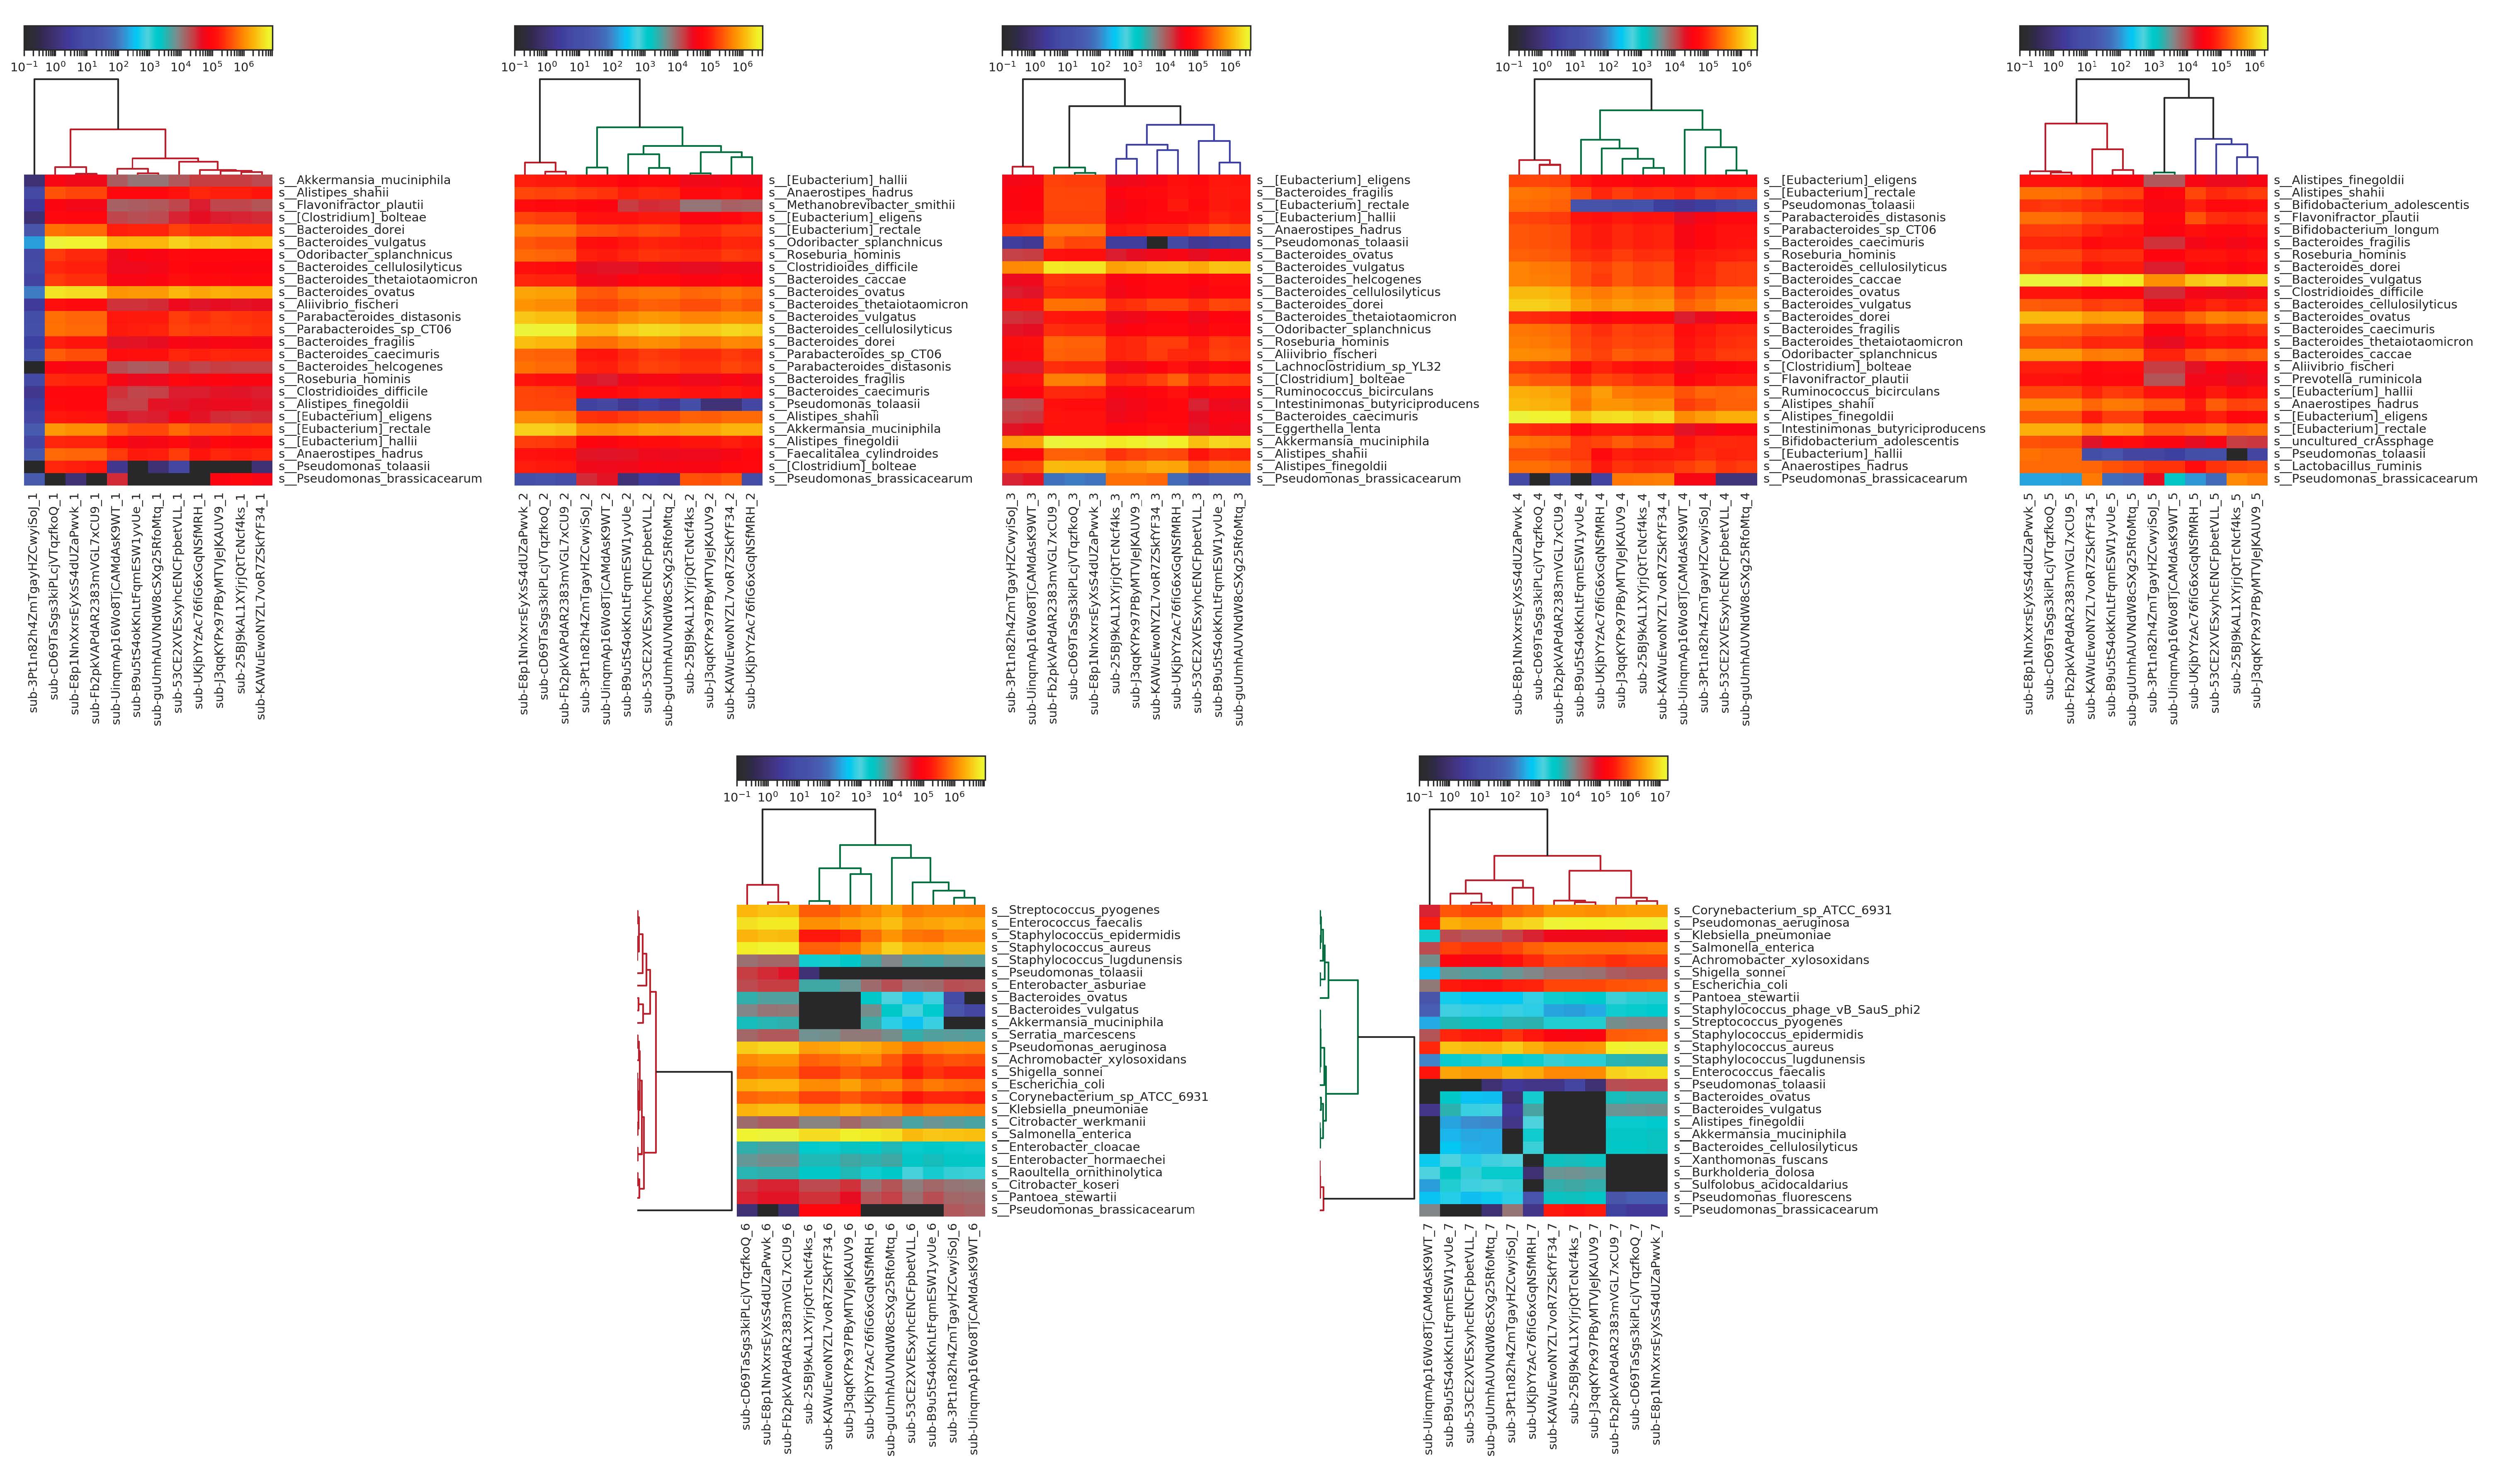
Figure 6: heatmaps produced using MetaPhlAn2 from Kraken results for metagenomic sequencing data for each individual sample. The fecal samples (1-5) are more similar than the DNA samples (6-7), most likely due to the DNA samples containing material from fewer total species, and thus being more prone to distortion from mis-identification.
Here, we can see that there’s overall very little variation within each sample for the fecal samples, with more variation observed in the purified DNA samples. This is to be expected, as the purified DNA samples contain DNA from fewer organisms and are thus more prone to mis-identification. Looking at these individual sample heatmaps, we can also easily distinguish which samples were replicates from the same participant, using the same method; for example, submissions sub-cD69TaSgs3kiPLcjVTqzfkoQ, sub-E8p1NnXxrsEyXsS4dUZaPwvk, and sub-Fb2pkVAPdAR2383mVGL7xCU9 are all replicates.
Summary and Next Steps
This initial examination of the Mosaic Standards challenge data has yielded several interesting insights about the data collected so far from participants in the Standards challenge. Results overall have shown a high degree of consistency when performed by the same laboratory using an identical method, but we observe significant variation between results provided by different groups. By comparing samples based on taxonomic similarity, we are able to cluster results by their sample of origin, more easily in metagenomic samples than in 16S results.
These current examinations of the data have compared different results, but haven’t yet attempted to draw ties between protocol choices in metadata and variation in taxonomic results. Future investigations will focus on examining which protocol choices are correlated with the greatest levels of variation, connecting the metadata with the taxonomic results of analyzing the submitted data.
The Mosaic Standards challenge is still open for submissions – it’s still possible to join the challenge, receive a FREE sample kit, and submit your results. As additional responses roll in from participants, we will continue to provide regular data freezes and additional analysis and insights from this evolving and multidimensional dataset. Sign up to receive a free sample kit here: https://www.platform.mosaicbiome.com/challenges/8