
Gabriel Al-Ghalith1, Sam Westreich2, Michalis Hadjithomas2
1Janssen Human Microbiome Institute, Janssen Research & Development, LLC, 2DNAnexus, Inc.
Mosaic Community Challenge: Clinical Strain Detection is the second in a series of three challenges on Mosaic sponsored by Janssen Research & Development, LLC through the Janssen Human Microbiome Institute designed to foster collaboration and advance microbiome research. In order to develop microbial-based products, it is critical to accurately detect microbes at the strain level. This challenge called upon the community to advance accurate strain-level profiling by determining whether or not known bacterial organisms were present in microbiome samples.
We recently announced that Richa Agarwala and Sergey Shiryev from the National Center for Biotechnology Information (NCBI) and a team from One Codex scored the highest in the challenge! Here we discuss the results and lessons learned in more detail.
Challenge Results
The challenge datasets were composed of four metagenomes generated from human fecal samples and genome datasets containing 40 genome assemblies. They were tasked with determining which of the 40 organisms were present in the four microbiome samples, with genomes of these 40 known organisms provided. There were a total of 54 submissions for the challenge. Below are the final standings for the challenge based on the best submission from each of the 14 participants (in case of ties, earliest submissions are placed higher):
| Ranking | Submitted As | Adjusted Rand Index (Score) | Accuracy | Submitted on |
| 1 | Richa Agarwala | 96.83% | 97.5% | 22-Jun-18 |
| 2 | One Codex | 96.83% | 97.5% | 03-Aug-18 |
| 3 | Anonymous | 90.60% | 92.5% | 03-Aug-18 |
| 4 | Andreu Paytuvi | 90.41% | 92.5% | 25-Jul-18 |
| 5 | Varun Aggarwala | 90.41% | 92.5% | 02-Aug-18 |
| 6 | Ardigen R&D | 87.67% | 90.0% | 03-Aug-18 |
| 7 | Krzysztof Odrzywolek (Ardigen) | 87.15% | 90.0% | 05-Jul-18 |
| 8 | Scott Sherrill-Mix | 77.19% | 82.5% | 25-Jul-18 |
| 9 | Jeremy | 77.19% | 82.5% | 31-Jul-18 |
| 10 | Caner Bagci | 70.35% | 77.5% | 25-Jul-18 |
| 11 | Gabe Al-Ghalith (BURST) | 66.86% | 75.0% | 03-Aug-18 |
| 12 | Anonymous | 36.64% | 55.0% | 27-Jul-18 |
| 13 | Anonymous | 17.42% | 32.5% | 03-Aug-18 |
| 14 | Bert Gold | 6.03% | 27.5% | 03-Aug-18 |
| NR | Gabe Al-Ghalith (SDP) | 96.83% | 97.5% | N/A |
Teams from NCBI and One Codex tied for first place with an Adjusted Rand Index score of 96.83%. Both of these participants correctly assigned 39 out of the 40 organisms. Although the teams had identical entries, they took entirely different approaches to the challenge: the NCBI team used a read alignment approach, while the One Codex team used a k-mer approach. Read about their approach below, and hear directly from the participants in a live webinar on October 10th (details below).
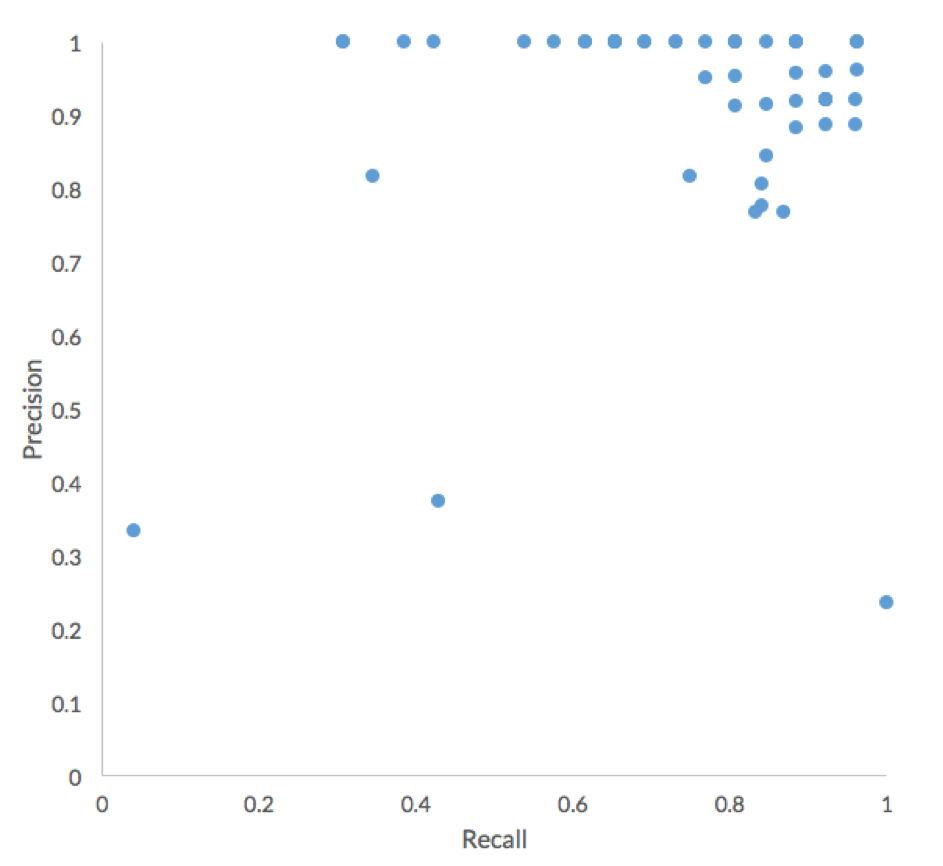
Overall, participants performed very well in terms of Precision, with the major difference between submissions being Recall.
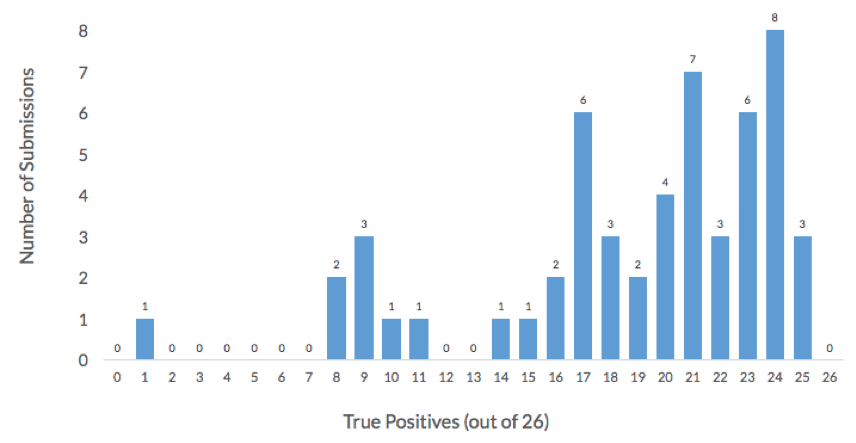
 More than half of the 54 submissions to the challenge achieved an accuracy higher than 75% and correctly assigned at least 30 of the 40 organisms in this challenge. Additionally, more than 50% of submissions achieved a True Positive rate higher than 75%, or more than 20 of the 26 non-decoy organisms were correctly assigned. The histogram below shows the distribution of True Positives across in the 54 challenge submissions. All the participants failed to correctly assign one organism, Lachnospiraceae_C_2.
Interestingly, the participants generally achieved high precision. As we will explore more later, this result indicates that high-scoring participants have used more refined approaches than naïve short-read alignment. Below are overviews of the approach used by the two teams with the best performing submissions (accuracy of 39/40). Both teams will present their approaches in more detail at our Mosaic webinar on Oct. 10.
The NCBI Team Approach
The NCBI team used the SRPRISM alignment software that provides explicit guarantees about its output. The software reports all alignments, up to 250 alignments with the same rank, as determined by the number of errors. If reads are paired, and a paired alignment within the specified insert range is found, then only paired alignments are reported.
The second step in the NCBI team’s approach was to take SRPRISM alignments and judge whether there is sufficient coverage for a reference in a read set. SRPRISM was allowed a maximum of seven errors during the alignment, but only error-free alignments were used for computing coverage as the goal was strain detection and not species detection. Because metagenomic reads usually have only partial coverage of a reference, . For instance, if a query aligned against positions 5000 to 5150 of a reference genome, the alignment would be recorded as having actually spanned 1000 bases before and after this range, in this case positions 4000 to 6150. A reference with at least 99% of its bases covered by at least one padded alignment was considered as present. The final step was a coarse-grained manual review of coverage by converting the coverage to a heatmap, which resulted in changing one value of the output matrix.
The One Codex Team Approach
One Codex used the upcoming next release of its core metagenomic classification software. At a high level, One Codex’s approach is a two-stage process that first breaks individual next-generation sequencing (NGS) reads down into short, k-length nucleotide strings (or “k-mers”) and classifies those k-mers against its proprietary, curated database. Next, the distribution of k-mers observed in the sample vs. available reference genomes is analyzed. The upcoming version of One Codex’s pipeline demonstrated here uses MinHash sketches to improve performance and scalability.
Hear directly from the winners about their methods during our free webinar October 10th at 10:00 a.m. PT (1pm ET). The webinar is free, register today!
Learnings from the Challenge
A simple but standard approach to the problem of identifying which genomes are present in a community is to perform short-read alignment against the database of genomes provided by the challenge and aggregate the alignment results by fraction of each genome covered. Higher coverage of a genome would indicate higher likelihood that genome is present in a given sample. To explore how the winning approaches achieve higher performance than this baseline method, we attempted a simple alignment and coverage approach ourselves. We compared two alignment approaches to calculate the fraction of each reference genome that is covered by the metagenomics reads in each sample. The first approach used ” run mode, which considers all possible alignments meeting or exceeding a specified sequence similarity threshold (in this case, 99%), then computes a simple coverage estimate in terms of percentage of genome covered. In this mode, BURST explicitly guarantees recovering all end-to-end alignments up to the similarity threshold, including an arbitrary number of read errors and number of alignments, using an exact (non-heuristic) alignment approach.
Below are the genome fractions aligned for each reference genome using these 2 approaches:
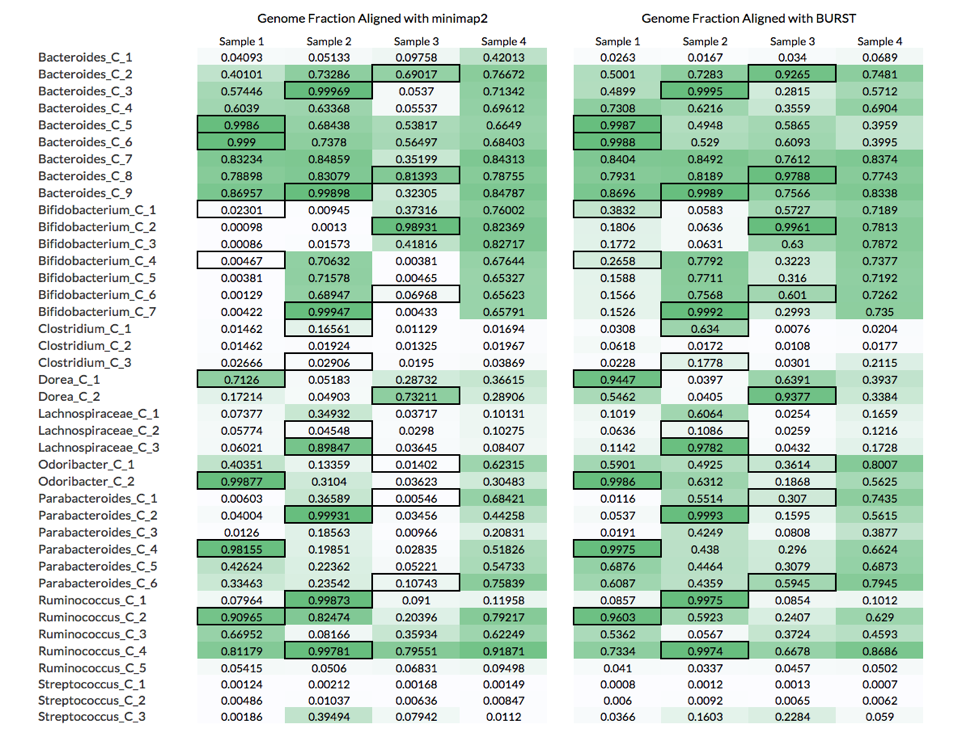
The table above compares the genome fractions achieved using these two alignment approaches.
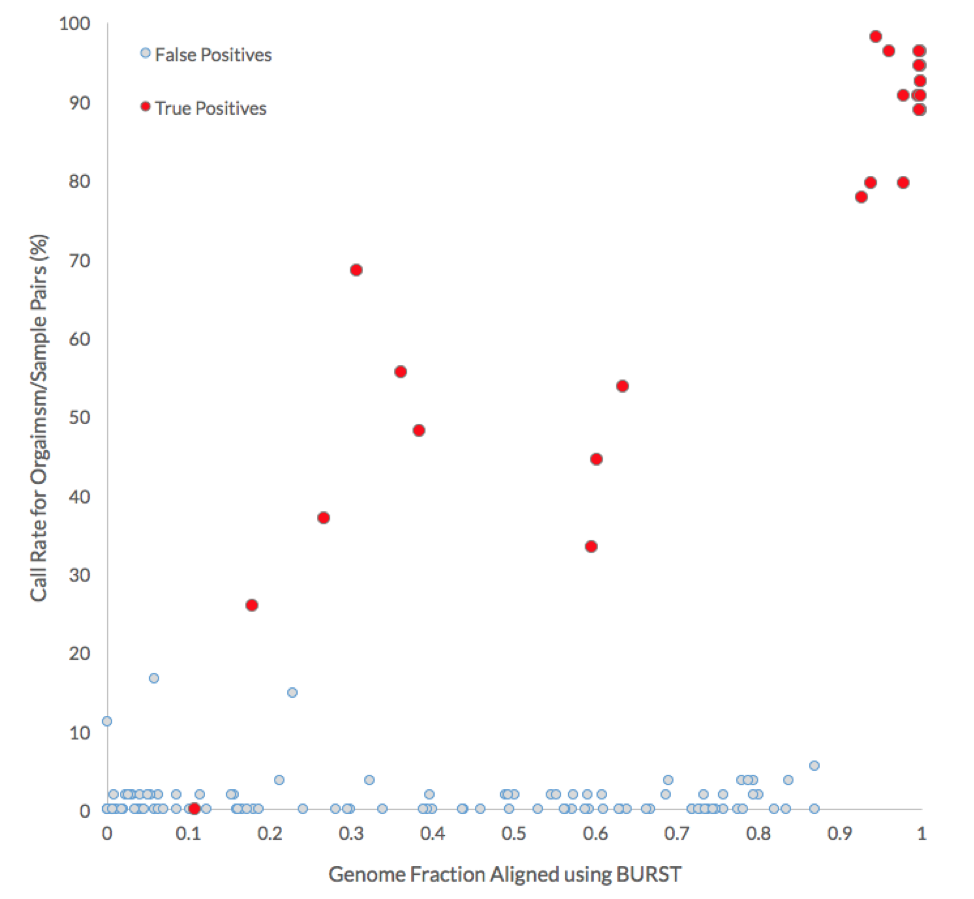
As shown in the plot below, the coverages for all reference genomes (light grey) are compared with those for the positive truths, i.e., genome fraction of reference genomes using the reads from their respective microbiome of origin (red).
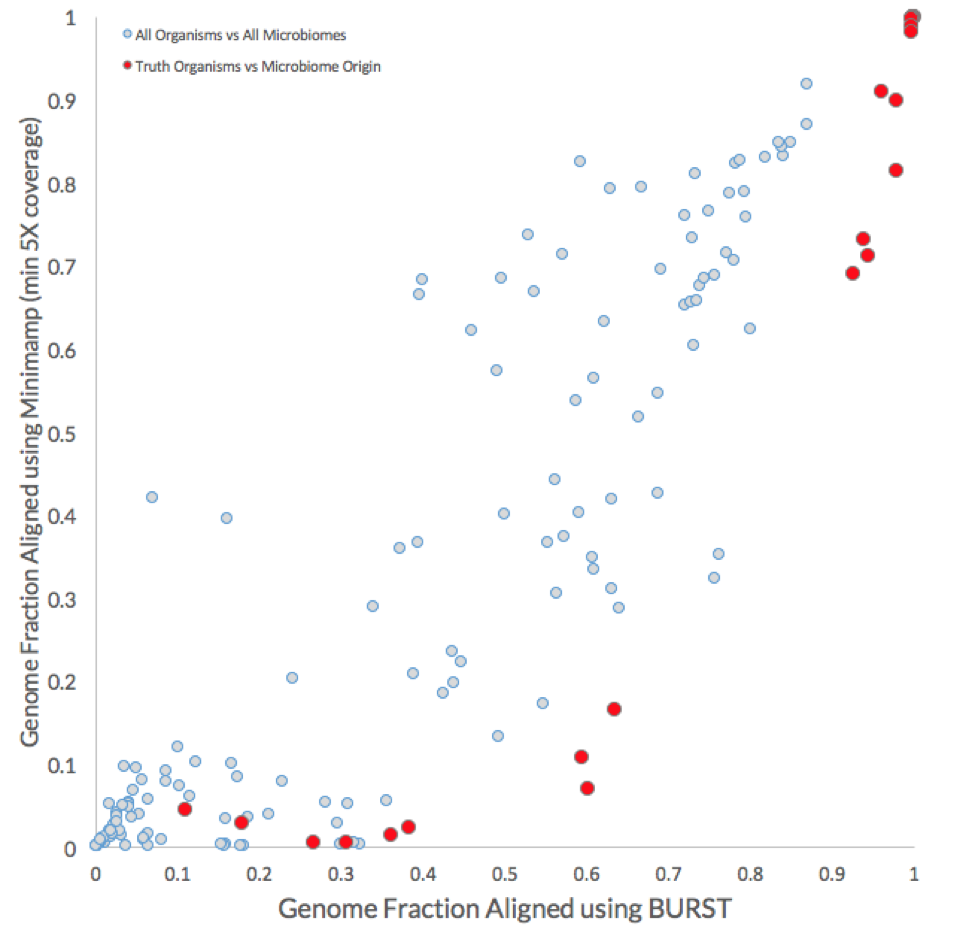
In general, the BURST approach achieved higher genome coverage. Most importantly, however, the BURST approach identified a minimum genome fraction threshold (between 0.87 and 0.93) that could be used to correctly assign 17 of the 26 non-decoy organisms without any false negatives. The equivalent minimum genome fraction threshold for the minimap2 approach is between 0.92 and 0.98 and would only correctly identify 11 out of the 26 positive truth organisms before false positive calls would be made.
What these results show is that although calculating the genome fraction covered by the metagenomic reads is important to properly identifying whether the organism is present, it is not sufficient. Nine out of the 26 non-decoy organisms had a genome fraction alignment below 70%, while 6 were below 40%. Furthermore, there were 8 cases where reads coming from a decoy sample (i.e., the microbiome was not the source of the organism) covered more of the reference genome than the reads source sample (see table below).
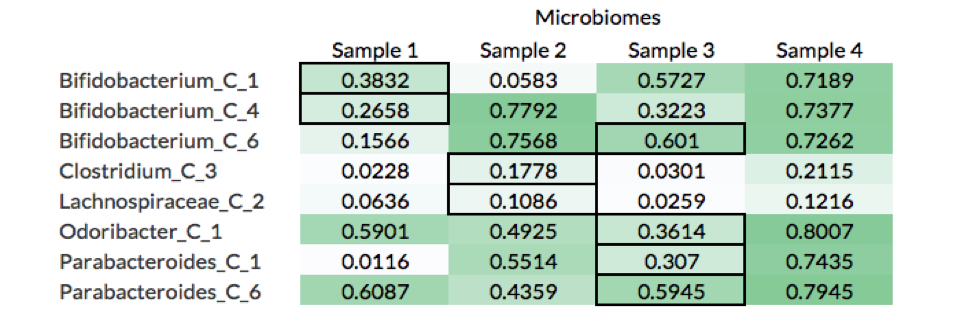
For example, Bifiidobacterium_C_1 had a higher fraction of its genome aligned by reads in Samples 3 and 4 than Sample 1, which is the microbiome from where the organism was isolated (black borders in table). A likely explanation of this is that Samples 3 and 4 have more closely related strains to Bifiidobacterium_C_1, which leads to more reads being mapped to the reference genome.
These results show that while calculating the raw genome fraction covered by the metagenomic reads is an important step to identifying whether the organism is present in a microbiome sample, it is not sufficient. A key difference from the winning NCBI method described previously is that no “padding” was used around the aligned regions; the NCBI team used 1kb of padding around each alignment.
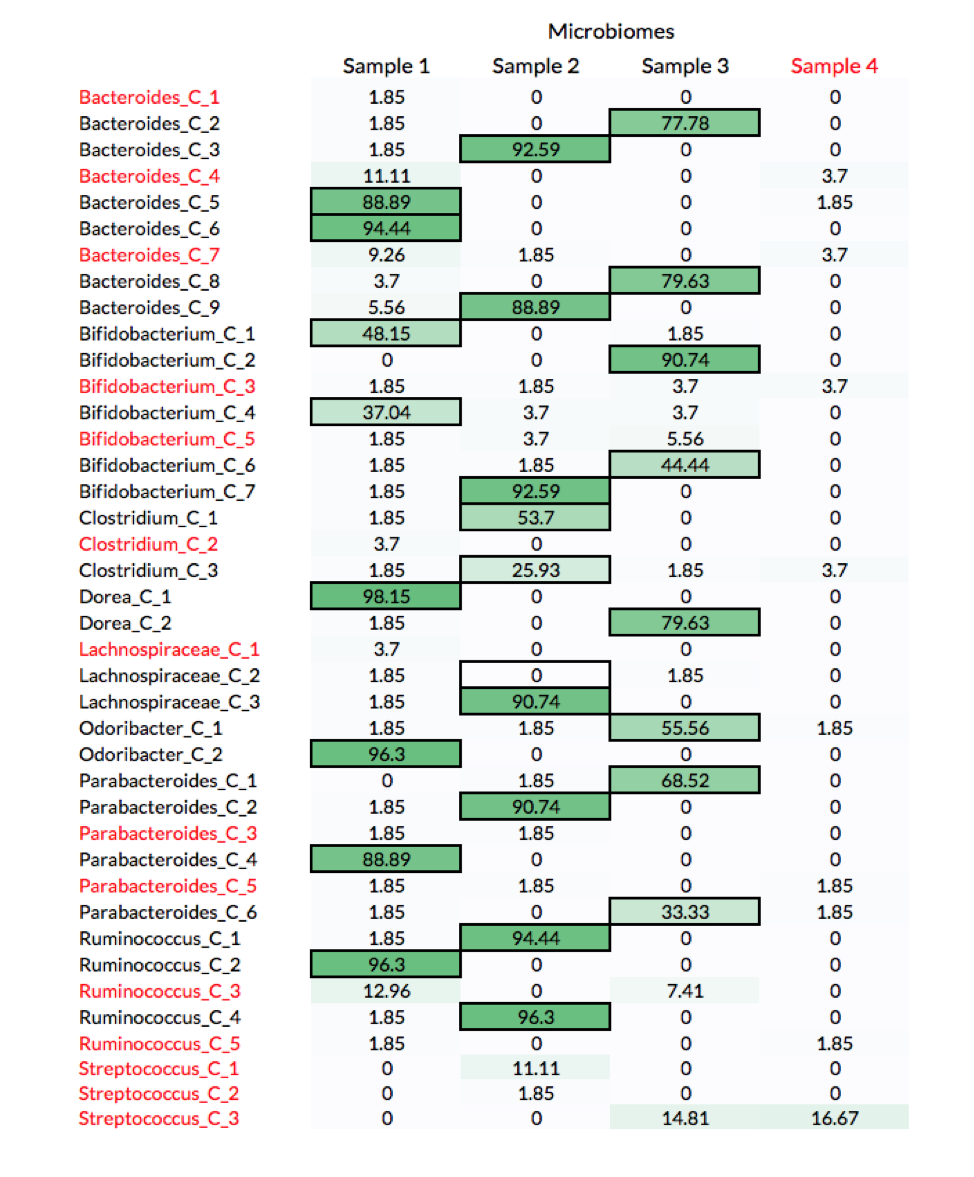
As expected, participants performed well in correctly identifying the source of non-decoy strains when there were enough reads to cover more than 90% of the organism’s genome. The table below shows the percentage of submissions with all possible organism-to-sample assignments. The truths for non-decoy organisms are highlighted with a border and decoy organisms and samples are in red. All the participants failed to correctly assign one organism, Lachnospiraceae_C_2, whose genome was covered only 11% by reads coming from the source microbiome (Sample 2).
The following graph compares the call rate for each organism with the genome fraction aligned by BURST. More than 75% of the submissions correctly identified the source of non-decoy genomes when more than 90% of their genome was covered by the reads of the source microbiome.
To hear more directly from the winners, register today for our free webinar on October 10th at 10:00 a.m. PT (1pm ET)!


.png)
.png)
.png)